

The two cases (slide 1 versus slide 2) demonstrates that at the same 20% growth (and the
Fantastic news! We've Found the answer you've been seeking!
Question:
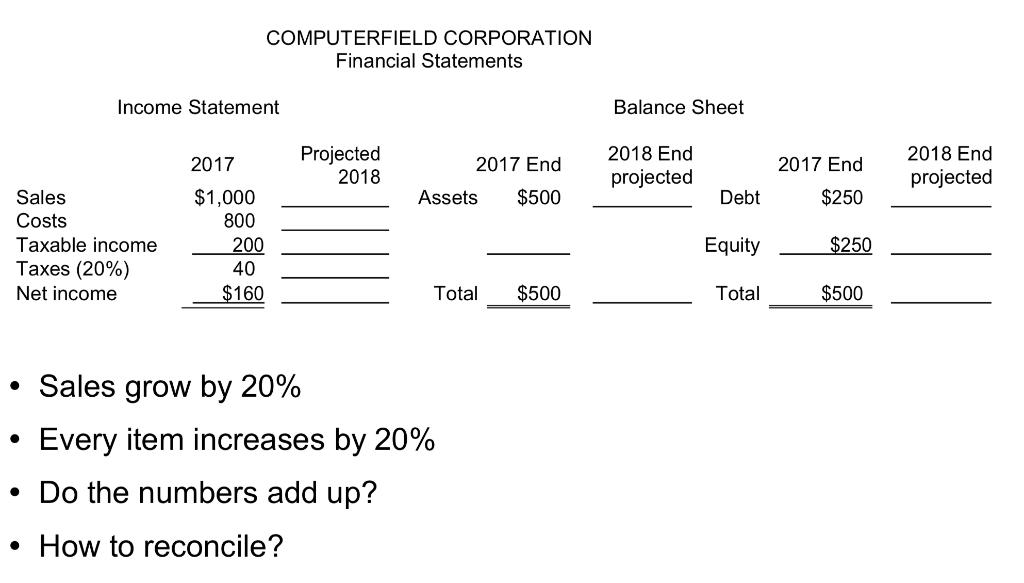
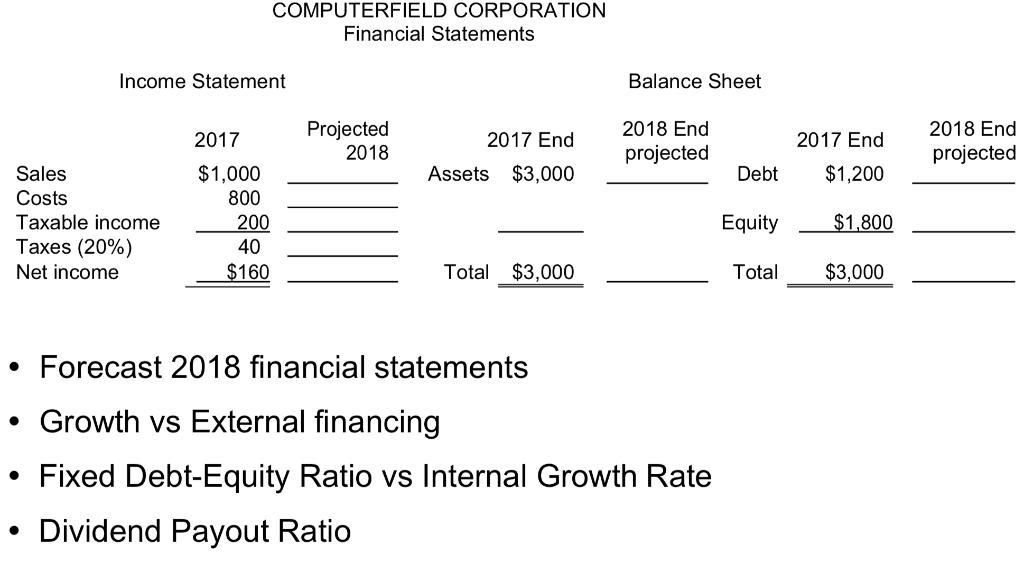
The two cases (slide 1 versus slide 2) demonstrates that at the same 20% growth (and the same assumption that Debt-Equity Ratios stay constant year to year) into the next year for both cases, slide 2 does not need EFN (rather, slide 2 could afford to pay out some dividend in the next year), but slide 3 does need EFN.
Please explain what fundamentally gives rise to the difference? Try to relate your explanation to the Sustainable Growth Rate (as well as the SGR formula given in the textbook), ROE and other concepts if needed. Show algebra if it helps.
Expert Answer:
ANSWER The difference in the two cases arises from the fact that in the first case the company is as... View the full answer

Related Book For 
Posted Date:
