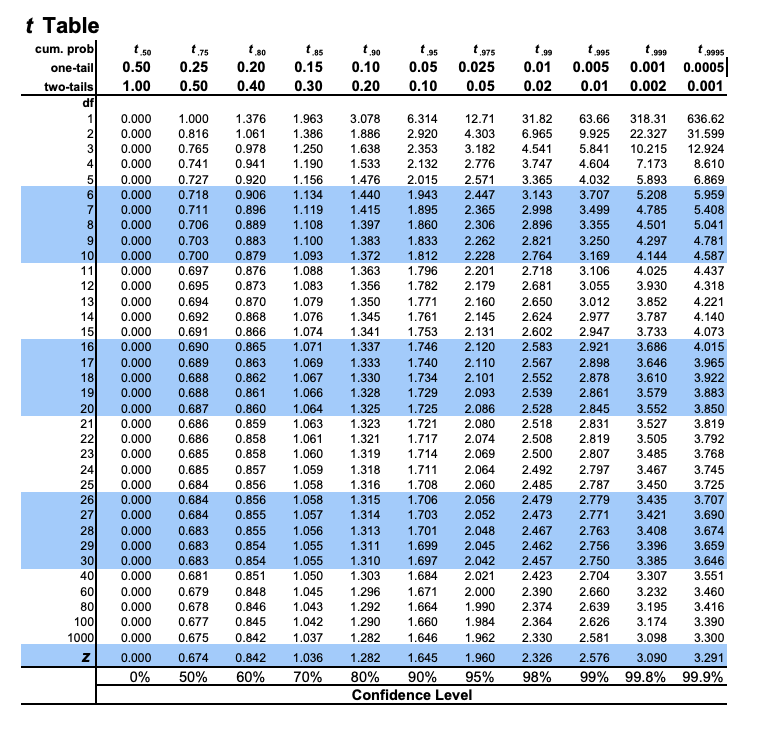
What is the t value with a 90% confidence interval for the true population mean if...
Fantastic news! We've Found the answer you've been seeking!
Question:
Transcribed Image Text:
What is the t value with a 90% confidence interval for the true population mean if the sample size n = 30? (Please keep three decimal places) t value = t Table cum. prob t.50 one-tail 0.50 two-tails 1.00 0.50 df 1 0.000 2 0.000 3 0.000 4 0.000 5 0.000 6 0.000 7 0.000 8 0.000 9 10 11 12 13 14 15 16 17 18 19 20 21 22 23 24 25 26 27 28 29 30 40 N 1.75 t.80 0.25 0.20 0.40 0.000 0.000 0.000 0.000 0.000 0.000 0.000 0.000 1.000 1.963 3.078 6.314 12.71 10.215 7.173 4.032 5.893 0.718 3.707 5.208 0.711 0.896 1.119 3.499 4.785 5.408 1.376 0.816 1.061 1.386 1.886 2.920 4.303 6.965 9.925 22.327 0.765 0.978 1.250 1.638 2.353 3.182 4.541 5.841 0.741 0.941 1.190 1.533 2.132 2.776 3.747 4.604 0.727 0.920 1.156 1.476 2.015 2.571 3.365 0.906 1.134 1.440 1.943 2.447 3.143 1.415 1.895 2.365 2.998 1.397 1.860 2.306 2.896 3.355 1.383 1.833 2.262 2.821 3.250 1.372 1.812 2.228 2.764 3.169 1.363 1.796 2.201 2.718 3.106 1.356 1.782 2.179 2.681 3.055 3.930 1.350 1.771 2.160 2.650 1.345 1.761 2.145 2.624 2.977 0.706 0.889 4.501 5.041 0.703 0.883 4.297 4.781 4.144 4.587 1.108 1.100 0.700 0.879 1.093 0.697 0.876 1.088 0.695 0.873 1.083 0.694 0.870 1.079 0.868 1.076 4.025 4.437 4.318 3.012 3.852 0.692 3.787 0.691 1.753 2.131 2.602 2.947 3.733 0.866 0.690 0.865 1.071 1.074 1.341 1.337 2.921 3.686 3.965 3.610 3.922 0.000 0.000 3.883 3.850 1.746 2.120 2.583 0.000 0.689 0.863 1.069 1.333 1.740 2.110 2.567 2.898 3.646 0.688 0.862 1.067 1.330 1.734 2.101 2.552 2.878 0.688 0.861 1.066 1.328 1.729 2.093 2.539 2.861 3.579 0.000 0.687 0.860 1.064 1.325 1.725 2.086 2.528 2.845 3.552 0.000 0.686 0.859 1.063 1.323 1.721 2.080 2.518 2.831 3.527 3.819 0.000 0.686 0.858 1.061 1.321 1.717 2.074 2.508 2.819 3.505 3.792 0.000 0.685 0.858 1.060 1.319 1.714 2.069 2.500 2.807 3.485 3.768 0.000 0.685 0.857 1.059 1.318 1.711 2.064 2.492 2.797 3.467 0.000 0.684 0.856 1.058 1.316 1.708 2.060 2.485 2.787 3.450 0.684 0.856 1.058 1.315 1.706 2.056 2.479 2.779 3.435 3.707 1.314 1.703 2.052 2.473 2.771 2.048 2.467 2.763 2.045 2.462 2.756 3.396 3.745 3.725 0.000 0.000 0.684 0.855 1.057 3.421 3.690 0.000 0.855 1.056 1.701 3.408 3.674 0.000 0.854 1.055 1.699 3.659 0.000 0.854 1.055 1.697 2.042 2.750 3.385 3.646 2.457 2.423 2.704 3.307 0.000 0.851 1.050 1.684 2.021 3.551 1.045 1.296 1.671 2.000 2.390 2.660 3.232 3.460 1.043 1.292 1.664 1.990 2.374 2.639 3.195 3.416 1.290 1.660 1.984 2.364 2.626 3.174 3.390 0.845 1.042 0.842 1.037 1.282 1.646 1.962 2.330 2.581 3.098 3.300 1.282 1.645 80% 90% 95% Confidence Level 3.291 99.9% 0.683 0.683 0.683 0.681 0.000 0.679 0.848 0.000 0.678 0.846 60 80 100 0.000 0.677 1000 0.000 0.675 0.000 0.674 0% 50% t.90 t.95 t 85 0.15 0.10 0.05 0.30 0.20 0.10 0.05 t 905 199 t 975 0.025 0.01 0.005 0.02 0.842 1.036 60% 70% 1.313 1.311 1.310 1.303 t 999 t 1995 0.001 0.0005 0.01 0.002 0.001 31.82 63.66 318.31 636.62 31.599 12.924 8.610 6.869 5.959 1.960 2.326 98% 2.576 3.090 99% 99.8% 4.221 4.140 4.073 4.015 What is the t value with a 90% confidence interval for the true population mean if the sample size n = 30? (Please keep three decimal places) t value = t Table cum. prob t.50 one-tail 0.50 two-tails 1.00 0.50 df 1 0.000 2 0.000 3 0.000 4 0.000 5 0.000 6 0.000 7 0.000 8 0.000 9 10 11 12 13 14 15 16 17 18 19 20 21 22 23 24 25 26 27 28 29 30 40 N 1.75 t.80 0.25 0.20 0.40 0.000 0.000 0.000 0.000 0.000 0.000 0.000 0.000 1.000 1.963 3.078 6.314 12.71 10.215 7.173 4.032 5.893 0.718 3.707 5.208 0.711 0.896 1.119 3.499 4.785 5.408 1.376 0.816 1.061 1.386 1.886 2.920 4.303 6.965 9.925 22.327 0.765 0.978 1.250 1.638 2.353 3.182 4.541 5.841 0.741 0.941 1.190 1.533 2.132 2.776 3.747 4.604 0.727 0.920 1.156 1.476 2.015 2.571 3.365 0.906 1.134 1.440 1.943 2.447 3.143 1.415 1.895 2.365 2.998 1.397 1.860 2.306 2.896 3.355 1.383 1.833 2.262 2.821 3.250 1.372 1.812 2.228 2.764 3.169 1.363 1.796 2.201 2.718 3.106 1.356 1.782 2.179 2.681 3.055 3.930 1.350 1.771 2.160 2.650 1.345 1.761 2.145 2.624 2.977 0.706 0.889 4.501 5.041 0.703 0.883 4.297 4.781 4.144 4.587 1.108 1.100 0.700 0.879 1.093 0.697 0.876 1.088 0.695 0.873 1.083 0.694 0.870 1.079 0.868 1.076 4.025 4.437 4.318 3.012 3.852 0.692 3.787 0.691 1.753 2.131 2.602 2.947 3.733 0.866 0.690 0.865 1.071 1.074 1.341 1.337 2.921 3.686 3.965 3.610 3.922 0.000 0.000 3.883 3.850 1.746 2.120 2.583 0.000 0.689 0.863 1.069 1.333 1.740 2.110 2.567 2.898 3.646 0.688 0.862 1.067 1.330 1.734 2.101 2.552 2.878 0.688 0.861 1.066 1.328 1.729 2.093 2.539 2.861 3.579 0.000 0.687 0.860 1.064 1.325 1.725 2.086 2.528 2.845 3.552 0.000 0.686 0.859 1.063 1.323 1.721 2.080 2.518 2.831 3.527 3.819 0.000 0.686 0.858 1.061 1.321 1.717 2.074 2.508 2.819 3.505 3.792 0.000 0.685 0.858 1.060 1.319 1.714 2.069 2.500 2.807 3.485 3.768 0.000 0.685 0.857 1.059 1.318 1.711 2.064 2.492 2.797 3.467 0.000 0.684 0.856 1.058 1.316 1.708 2.060 2.485 2.787 3.450 0.684 0.856 1.058 1.315 1.706 2.056 2.479 2.779 3.435 3.707 1.314 1.703 2.052 2.473 2.771 2.048 2.467 2.763 2.045 2.462 2.756 3.396 3.745 3.725 0.000 0.000 0.684 0.855 1.057 3.421 3.690 0.000 0.855 1.056 1.701 3.408 3.674 0.000 0.854 1.055 1.699 3.659 0.000 0.854 1.055 1.697 2.042 2.750 3.385 3.646 2.457 2.423 2.704 3.307 0.000 0.851 1.050 1.684 2.021 3.551 1.045 1.296 1.671 2.000 2.390 2.660 3.232 3.460 1.043 1.292 1.664 1.990 2.374 2.639 3.195 3.416 1.290 1.660 1.984 2.364 2.626 3.174 3.390 0.845 1.042 0.842 1.037 1.282 1.646 1.962 2.330 2.581 3.098 3.300 1.282 1.645 80% 90% 95% Confidence Level 3.291 99.9% 0.683 0.683 0.683 0.681 0.000 0.679 0.848 0.000 0.678 0.846 60 80 100 0.000 0.677 1000 0.000 0.675 0.000 0.674 0% 50% t.90 t.95 t 85 0.15 0.10 0.05 0.30 0.20 0.10 0.05 t 905 199 t 975 0.025 0.01 0.005 0.02 0.842 1.036 60% 70% 1.313 1.311 1.310 1.303 t 999 t 1995 0.001 0.0005 0.01 0.002 0.001 31.82 63.66 318.31 636.62 31.599 12.924 8.610 6.869 5.959 1.960 2.326 98% 2.576 3.090 99% 99.8% 4.221 4.140 4.073 4.015
Expert Answer:
Answer rating: 100% (QA)
Given sample size n30 dfn1 df29 a010 using t tablet value with 90 CI with 29 df is 1699 t value 1699 ... View the full answer
Related Book For
Probability And Statistics For Engineering And The Sciences
ISBN: 9781305251809
9th Edition
Authors: Jay L. Devore
Posted Date:
Students also viewed these mathematics questions
-
If the sample size n is doubled, by how much is the length of the CI on in Equation 8-7 reduced? What happens to the length of the interval if the sample size is increased by a factor of four?
-
17 18 19 20 21 22 23 7285 24 26 The original coordinates of the point in polor coordinates are X'-r cos (+0) and Yor cos (+0) 29 30 A decoder is a combinational circuit that converts binary...
-
123456789 10 11 12 13 14 15 16 17 18 19 20 21 22 23 24 200 210 230 260 280 200 210 230 260 280 Twenty-four individuals were analyzed for 2 microsatellite markers. The experiment involved DNA...
-
Selected accounts from the ledger of Restoration Arts for the fiscal year ended April 30, 2019, are as follows: Prepare a statement of owner's equity for the year. Apr 30 Doug Stone Capital Doug...
-
Estimation of void fraction of a packed column, a tube of 146 sq. in. cross section and 73 in. height is packed with spherical particles of diameter 2 mm. When a pressure difference of 158 psi is...
-
Find a 99% CI for the population variance of the concentrations? Pharmacology Suppose we want to estimate the concentration (g/mL) of a specific dose of ampicillin in the urine after various periods...
-
Harlem Dance Company had budgeted for 4,000 hours of dance instruction for the month of September. Its standard rate for instruction is \($6\) per hour. Actual revenues for the month of September...
-
Easy Living Industries manufactures carpets, furniture and cushions in three separate divisions, the company's profit statement is presented below: Additional information regarding Easy Living...
-
White Diamond Flour Company manufactures flour by a series of three processes, beginning with wheat grain being introduced in the Milling Department. From the Milling Department, the materials pass...
-
Suppose that an intermediary faces a certain number of buyers and sell- ers. The intermediary sets usage prices P, and P, to be paid, respectively, by sellers and buyers whenever there is an...
-
Sam has been a resident of Ottawa, Canada all of his life. He was recently offered a lucrative job with an investment firm in Chicago, IL. After careful consideration he has decided to make the move...
-
How do emerging trends in organizational behavior research, such as the study of emotional intelligence, mindfulness practices, and diversity and inclusion initiatives, contribute to the development...
-
How have sales order processes through the SAP ERP system changed the organization in relation to business? Explains the production process of a company through the use of SAP ERP. Mention five...
-
Rings Company has three product lines, A, B, and C. The following financial information is available: Item Sales Product Line A Product Line B Product Line C $ 42,000 $ 75,000 $ 18,000 Variable costs...
-
Determine the support forces acting on the beam (10 ft) at points A and D. pinned 1000 lb 45 3 ft B 2 ft C 400 lb/ft 5 ft D roller
-
HOW THIS POINTS CAN BE REALATED TO A CLICK THROUGH RATE AN EMAIL AS A MARKETING CAMPAING FOR A HOTEL?
-
17) Luther Industries has a dividend yield of 6.25% and a cost of equity capital of 15%. Luther Industries' dividends are expected to grow at a constant rate indefinitely. The growth rate of Luther's...
-
Define the term utility software and give two examples.
-
Reconsider Example 10.8 involving an investigation of the effects of different heat treatments on the yield point of steel ingots. a. If J = 8 and ( = 1, what is for a level .0 = F test when 1 = 2,...
-
Let X denote the proportion of allotted time that a randomly selected student spends working on a certain aptitude test. Suppose the pdf of X is where - 1 a. Use the method of moments to obtain an...
-
Refer to Exercise 34. Describe the pooled t test for testing H0: µ1 - µ2 = Î0 when both population distributions are normal with Ï1 = Ï2. Then use this test procedure to...
-
The Trapani Company had the following actual data for 2006 and 2007: The basic production data at standard unit costs for the two years were Fixed factory overhead was budgeted at $98,000 per year....
-
The Carley Company differs from the Marple Company (described in Problem 4-21) in only one respect: it has both variable and fixed manufacturing costs. Its variable costs are $0.14 per litre and its...
-
Form groups of four persons each. Each person should select one of the following four roles (if groups have between four and eight persons, two persons can play any of the roles in the exercise):...
Study smarter with the SolutionInn App