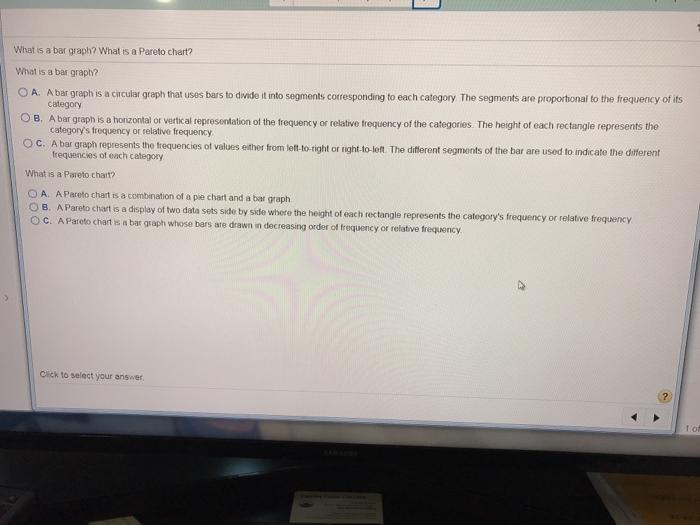
What is a bar graph? What is a Pareto chart? What is a bar graph? OA....
Fantastic news! We've Found the answer you've been seeking!
Question:
Transcribed Image Text:
What is a bar graph? What is a Pareto chart? What is a bar graph? OA. A bar graph is a circular graph that uses bars to divide it into segments corresponding to each category. The segments are proportional to the frequency of its category OB. A bar graph is a horizontal or vertical representation of the frequency or relative frequency of the categories. The height of each rectangle represents the category's frequency or relative frequency OC. A bar graph represents the frequencies of values either from left-to-right or right-to-left. The different segments of the bar are used to indicate the different frequencies of each category What is a Pareto chart? OA. A Pareto chart is a combination of a pie chart and a bar graph OB. A Pareto chart is a display of two data sets side by side where the height of each rectangle represents the category's frequency or relative frequency OC. A Pareto chart is a bar graph whose bars are drawn in decreasing order of frequency or relative frequency. Click to select your answer. 1 of What is a bar graph? What is a Pareto chart? What is a bar graph? OA. A bar graph is a circular graph that uses bars to divide it into segments corresponding to each category. The segments are proportional to the frequency of its category OB. A bar graph is a horizontal or vertical representation of the frequency or relative frequency of the categories. The height of each rectangle represents the category's frequency or relative frequency OC. A bar graph represents the frequencies of values either from left-to-right or right-to-left. The different segments of the bar are used to indicate the different frequencies of each category What is a Pareto chart? OA. A Pareto chart is a combination of a pie chart and a bar graph OB. A Pareto chart is a display of two data sets side by side where the height of each rectangle represents the category's frequency or relative frequency OC. A Pareto chart is a bar graph whose bars are drawn in decreasing order of frequency or relative frequency. Click to select your answer. 1 of What is a bar graph? What is a Pareto chart? What is a bar graph? OA. A bar graph is a circular graph that uses bars to divide it into segments corresponding to each category. The segments are proportional to the frequency of its category OB. A bar graph is a horizontal or vertical representation of the frequency or relative frequency of the categories. The height of each rectangle represents the category's frequency or relative frequency OC. A bar graph represents the frequencies of values either from left-to-right or right-to-left. The different segments of the bar are used to indicate the different frequencies of each category What is a Pareto chart? OA. A Pareto chart is a combination of a pie chart and a bar graph OB. A Pareto chart is a display of two data sets side by side where the height of each rectangle represents the category's frequency or relative frequency OC. A Pareto chart is a bar graph whose bars are drawn in decreasing order of frequency or relative frequency. Click to select your answer. 1 of What is a bar graph? What is a Pareto chart? What is a bar graph? OA. A bar graph is a circular graph that uses bars to divide it into segments corresponding to each category. The segments are proportional to the frequency of its category OB. A bar graph is a horizontal or vertical representation of the frequency or relative frequency of the categories. The height of each rectangle represents the category's frequency or relative frequency OC. A bar graph represents the frequencies of values either from left-to-right or right-to-left. The different segments of the bar are used to indicate the different frequencies of each category What is a Pareto chart? OA. A Pareto chart is a combination of a pie chart and a bar graph OB. A Pareto chart is a display of two data sets side by side where the height of each rectangle represents the category's frequency or relative frequency OC. A Pareto chart is a bar graph whose bars are drawn in decreasing order of frequency or relative frequency. Click to select your answer. 1 of
Expert Answer:
Answer rating: 100% (QA)
The detailed answer for the above question is provided below Answer Part1 A ... View the full answer
Related Book For
Posted Date:
Students also viewed these mathematics questions
-
I hate grits so much that the very idea of owning grits makes me sick. I do, on the other hand, enjoy a good breakfast of Coco Puffs Cereal. A: In each of the following, put boxes of grits on the...
-
I hate numbers, Claude stated emphatically. I didnt get into business just to have to tie myself to a computer or a calculator. All this paperwork is driving me nuts. Give me one good reason why I...
-
What are usury laws? Why do economists hate them?
-
Payroll Assignment - (50 Marks) The following employees are working in the ABC Clinic, they are paid biweekly. Calculate the gross income, net income, and the total remittance that ABC is to report...
-
The Comparative statements of cash flows for Executive style corporation, a manufacturer of high-quality suits for men, appear on the next page. To expand its markets and familiarity with its brand,...
-
The dynamics of a controlled submarine are significantly different from those of an aircraft, missile, or surface ship. This difference results primarily from the moment in the vertical plane due to...
-
Find the adjoint operator and its domain for \(L u=u^{\prime \prime}+4 u^{\prime}-3 u\), \(u^{\prime}(0)+4 u(0)=0, u^{\prime}(1)+4 u(1)=0\).
-
The following information relates to depreciable assets of Strata Technologies. (a) Machine A was purchased for $80,000 on January 1, 2006. The entire cost was erroneously expensed in the year of...
-
Using the worksheets provided, prepare the financial statements for ABC Legal Services based on the trial balance shown below. Assume that the adjustments have been entered in the journal and have...
-
On December 1, 2020, Papadopoulos Seasonings had the following account balances. During December, the company completed the following transactions. Dec. 7 Received 3,600 cash from customers in...
-
In the following independent case determine the maximum amount of 2019 personal tax credits, including transfers from a spouse or dependent, that can be applied against federal Tax Payable by the...
-
Show the following list after each pass of an insertion sort (the list is being sorted into ascending order). 853914
-
Describe the file system, or systems used by Microsoft Windows operating system.?
-
Within a Microsoft Windows Server 2016 environment, who has access rights to the EFS features and functions in the server?
-
CCLW 6450M - CANADIAN TORT LAW PROBLEM-BASED LEARNING GROUP ASSIGNMENT #1 You run a large and lucrative bar and restaurant, and you have just hired a new bouncer. You have explained to him that it is...
-
The Common European Asylum System (CEAS) was established by the European Union (EU) in 1999 under the Amsterdam Treaty to ensure that asylum seekers and refugees are treated fairly and consistently...
-
Target's Disastrous Failed Expansion into Canada Target is a well-loved brand in the US, so it seemed only natural that it would be just as well-received with expansion into Canada. Target executives...
-
Which of the following streaming TV devices does not involve use of a remote controller? A) Google Chromecast B) Apple TV C) Amazon Fire TV D) Roku
-
A nutritionist wants to estimate the difference between the percentage of men and women who have high cholesterol. What sample size should be obtained if she wishes the estimate to be within 2...
-
Clarinex-D is a medication whose purpose is to reduce the symptoms associated with a variety of allergies. In clinical trials of Clarinex-D, 5% of the patients in the study experienced insomnia as a...
-
For each of the following statements, explain whether you think the variables will have positive correlation, negative correlation, or no correlation. Support your opinion. (a) Number of cigarettes...
-
Show that the decomposition (10.37) of the nonlinear term is correct. Use direct substitution of (10.36) into the expression for one component of vector \(N\).
-
For the flow in Problem 7, write the boundary conditions for pressure when the flow is incompressible and inviscid and there is no body force.
-
If your course involves exercises with a CFD code, study the manual to determine which of the projection schemes discussed in Section 10.4 (SIMPLE, SIMPLEC, SIMPLER, PISO) are implemented. Are there...
Study smarter with the SolutionInn App