

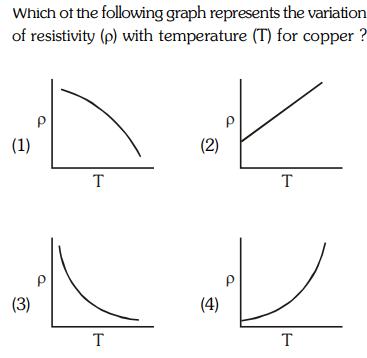
Which of the following graph represents the variation of resistivity (p) with temperature (T) for copper?...
Fantastic news! We've Found the answer you've been seeking!
Question:
Expert Answer:

Related Book For 
Chemistry The Central Science
ISBN: 978-0321696724
12th edition
Authors: Theodore Brown, Eugene LeMay, Bruce Bursten, Catherine Murphy, Patrick Woodward
Posted Date:
