

Wilson Distributors, Inc. is a distributor of Miller beer as well as several lesser-known brands. The...
Fantastic news! We've Found the answer you've been seeking!
Question:
Transcribed Image Text:
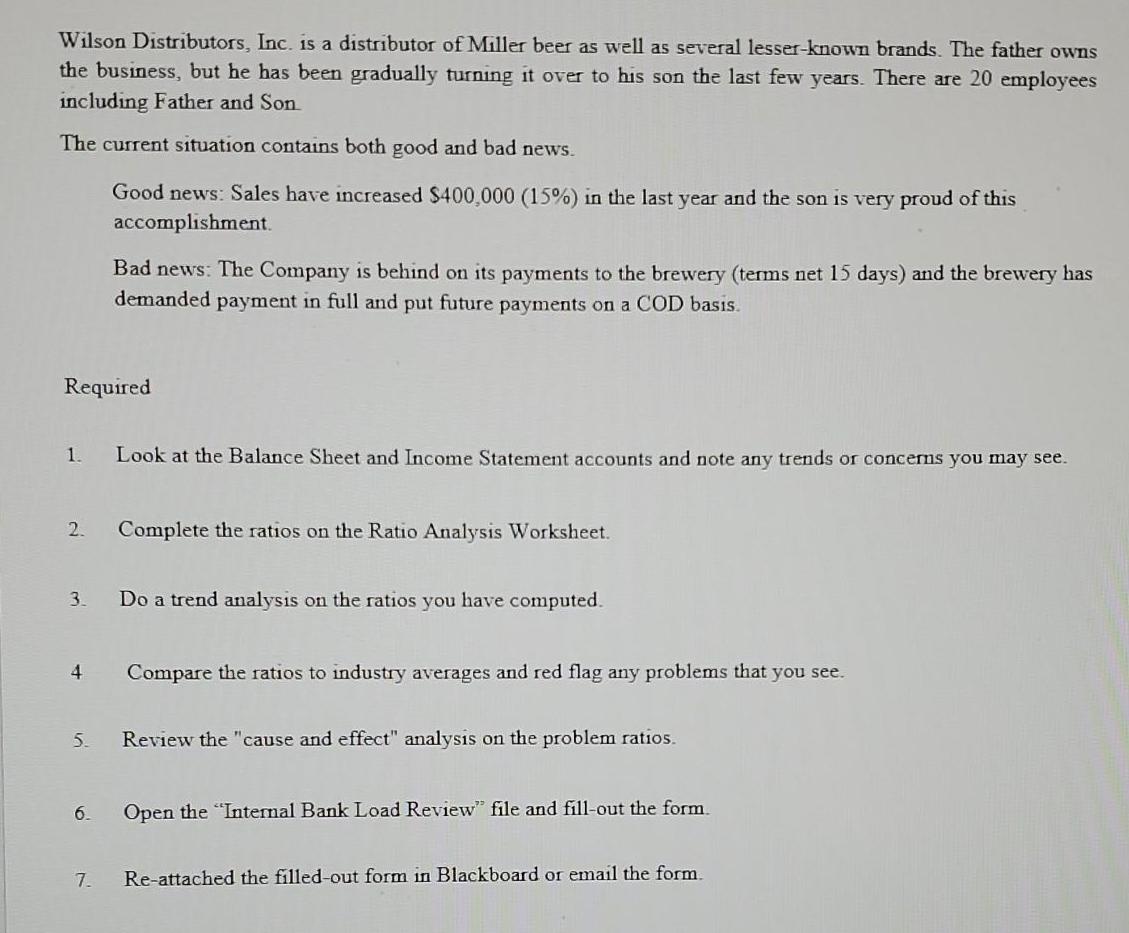
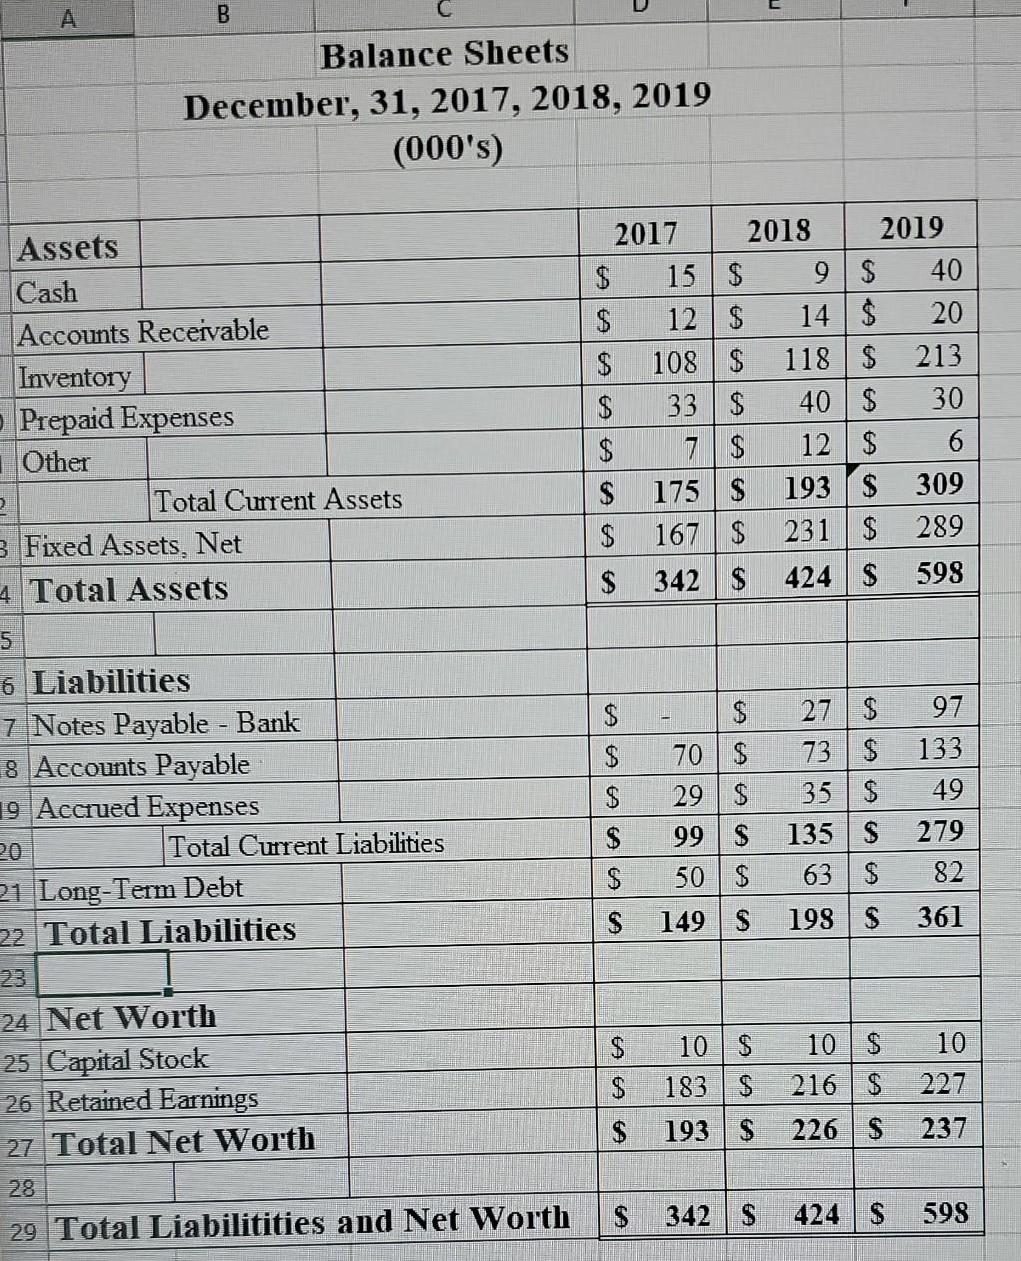
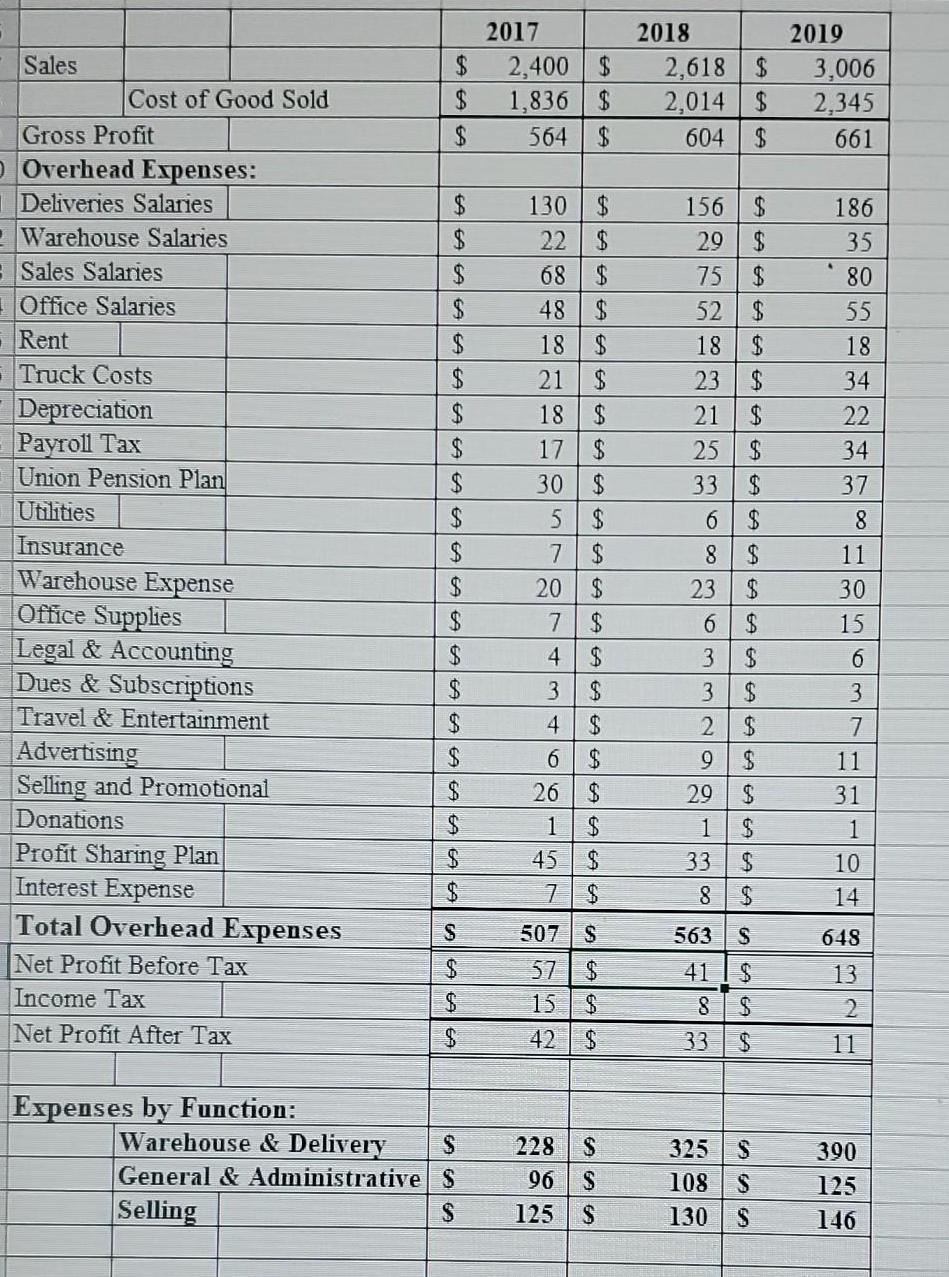
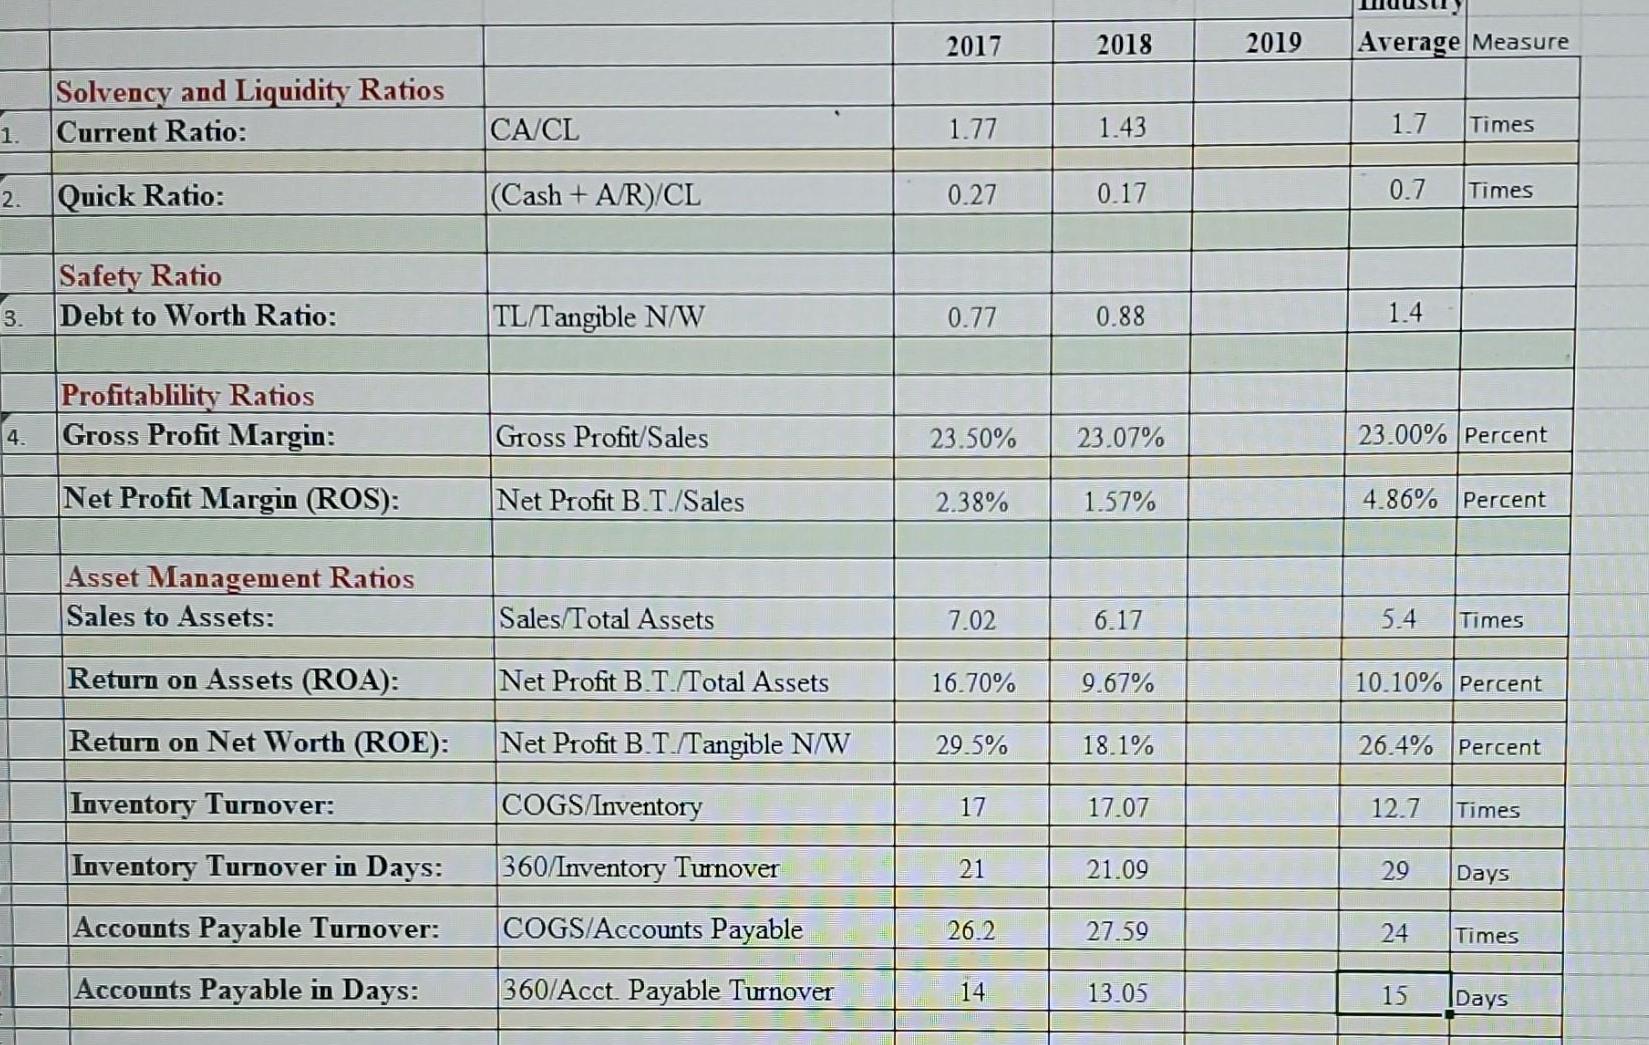
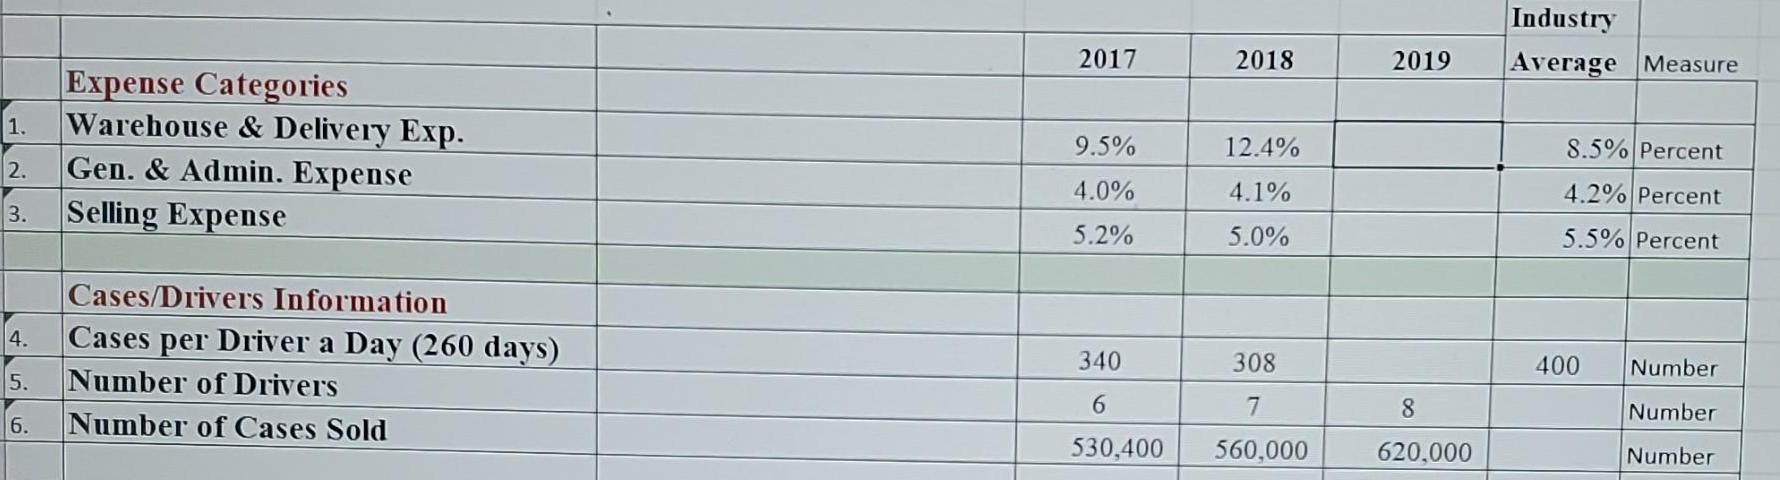
Wilson Distributors, Inc. is a distributor of Miller beer as well as several lesser-known brands. The father owns the business, but he has been gradually turning it over to his son the last few years. There are 20 employees including Father and Son The current situation contains both good and bad news. Good news: Sales have increased $400,000 (15%) in the last year and the son is very proud of this accomplishment. Required 1. 2. 3 4 5. 6. Bad news: The Company is behind on its payments to the brewery (terms net 15 days) and the brewery has demanded payment in full and put future payments on a COD basis. 7. Look at the Balance Sheet and Income Statement accounts and note any trends or concerns you may see. Complete the ratios on the Ratio Analysis Worksheet. Do a trend analysis on the ratios you have computed. Compare the ratios to industry averages and red flag any problems that you see. Review the "cause and effect" analysis on the problem ratios. Open the "Internal Bank Load Review" file and fill-out the form. Re-attached the filled-out form in Blackboard or email the form. 2 A B Balance Sheets December, 31, 2017, 2018, 2019 (000's) Assets Cash Accounts Receivable Inventory Prepaid Expenses Other Total Current Assets 3 Fixed Assets, Net 4 Total Assets 5 6 Liabilities 7 Notes Payable - Bank 8 Accounts Payable 19 Accrued Expenses Total Current Liabilities 21 Long-Term Debt 22 Total Liabilities 24 Net Worth 25 Capital Stock 26 Retained Earnings 27 Total Net Worth 28 29 Total Liabilitities and Net Worth $ $ FA 2017 $ $ $ $ GAGAGA A $ $ $ $ $ 15 $ 12 $ 108 $ 33 $ 7 $ 175 $ 167 $ 342 $ GA 2018 $ 70 $ 29 $ 99 S 50 $ 149 S 342 $ 10 $ $ 183 $ $ 193 $ 2019 9 $ 14 $ 118 $ 40 $ 12 $ 193 $ 309 231 $ 289 424 $ 598 27 $ 73 $ 35 $ 135 S 63 $ 198 $ 10 $ 216 $ 226 S 40 20 213 30 6 424 S 97 133 49 279 82 361 10 227 237 598 Sales Cost of Good Sold Gross Profit Overhead Expenses: Deliveries Salaries Warehouse Salaries Sales Salaries Office Salaries Rent Truck Costs Depreciation Payroll Tax Union Pension Plan Utilities Insurance Warehouse Expense Office Supplies Legal & Accounting Dues & Subscriptions Travel & Entertainment Advertising Selling and Promotional Donations Profit Sharing Plan Interest Expense Total Overhead Expenses Net Profit Before Tax Income Tax Net Profit After Tax Expenses by Function: $ $ $ $ $ $ GA GA GA GA GA GA GA GA GA GA GA GA GA $ $ $ $ $ $ $ $ $ $ $ $ 69 69 69 69 69 69 $ $ $ S $ $ Warehouse & Delivery General & Administrative S Selling 696969 $ 2017 2,400 $ 1,836 $ 564 130 C4FQ3581 21 22 $ 69 5 7 $ 20 GALA $ 68 48 $ 18 $ 99 $ GALA 18 $ 17 $ 30 $ GA $ $ 7 $ 4 $ GA GA 3 $ 4 $ $ 26 $ 1 45 7 $ $ $ 507 S 57 $ 15 $ 42 $ 228 $ 96 S 125 S 2018 2,618 $ 3,006 2,014 $ 2,345 604 $ 661 SEKS83 156 $ 29 $ 75 $ 52 $ 18 $ 22 23 21 $ 25 $ 33 $ 6 8 $ $ 23 $ 6 $ 3 $ $ $ $ $ 32 9 29 1 33 $ $ 8 $ 69 563 S 8 33 69 69 69 69 $ $ 2019 325 S 108 S 130 S 186 35 80 55 18 34 22 34 37 8 11 30 15 6 3 7 11 31 1 10 14 648 13 2 11 390 125 146 1. 2. 3. 4. Solvency and Liquidity Ratios Current Ratio: Quick Ratio: Safety Ratio Debt to Worth Ratio: Profitablility Ratios Gross Profit Margin: Net Profit Margin (ROS): Asset Management Ratios Sales to Assets: Return on Assets (ROA): Return on Net Worth (ROE): Inventory Turnover: Inventory Turnover in Days: Accounts Payable Turnover: Accounts Payable in Days: CA/CL (Cash + A/R)/CL TL/Tangible N/W Gross Profit/Sales Net Profit B.T./Sales Sales/Total Assets Net Profit B.T./Total Assets Net Profit B.T./Tangible N/W COGS/Inventory 360/Inventory Turnover COGS/Accounts Payable 360/Acct. Payable Turnover 2017 1.77 0.27 0.77 23.50% 2.38% 7.02 16.70% 29.5% 17 21 26.2 14 2018 1.43 0.17 0.88 23.07% 1.57% 6.17 9.67% 18.1% 17.07 21.09 27.59 13.05 2019 Average Measure 1.7 0.7 Times 1.4 23.00% Percent 4.86% Percent 5.4 Times 10.10% Percent 12.7 26.4% Percent 29 24 Times 15 Times Days Times Days Expense Categories 1. Warehouse & Delivery Exp. 2. Gen. & Admin. Expense Selling Expense 3. Cases/Drivers Information Cases per Driver a Day (260 days) 4. 5. Number of Drivers 6. Number of Cases Sold 2017 9.5% 4.0% 5.2% 340 6 530,400 2018 12.4% 4.1% 5.0% 308 7 560,000 2019 8 620,000 Industry Average Measure 8.5% Percent 4.2% Percent 5.5% Percent 400 Number Number Number Wilson Distributors, Inc. is a distributor of Miller beer as well as several lesser-known brands. The father owns the business, but he has been gradually turning it over to his son the last few years. There are 20 employees including Father and Son The current situation contains both good and bad news. Good news: Sales have increased $400,000 (15%) in the last year and the son is very proud of this accomplishment. Required 1. 2. 3 4 5. 6. Bad news: The Company is behind on its payments to the brewery (terms net 15 days) and the brewery has demanded payment in full and put future payments on a COD basis. 7. Look at the Balance Sheet and Income Statement accounts and note any trends or concerns you may see. Complete the ratios on the Ratio Analysis Worksheet. Do a trend analysis on the ratios you have computed. Compare the ratios to industry averages and red flag any problems that you see. Review the "cause and effect" analysis on the problem ratios. Open the "Internal Bank Load Review" file and fill-out the form. Re-attached the filled-out form in Blackboard or email the form. 2 A B Balance Sheets December, 31, 2017, 2018, 2019 (000's) Assets Cash Accounts Receivable Inventory Prepaid Expenses Other Total Current Assets 3 Fixed Assets, Net 4 Total Assets 5 6 Liabilities 7 Notes Payable - Bank 8 Accounts Payable 19 Accrued Expenses Total Current Liabilities 21 Long-Term Debt 22 Total Liabilities 24 Net Worth 25 Capital Stock 26 Retained Earnings 27 Total Net Worth 28 29 Total Liabilitities and Net Worth $ $ FA 2017 $ $ $ $ GAGAGA A $ $ $ $ $ 15 $ 12 $ 108 $ 33 $ 7 $ 175 $ 167 $ 342 $ GA 2018 $ 70 $ 29 $ 99 S 50 $ 149 S 342 $ 10 $ $ 183 $ $ 193 $ 2019 9 $ 14 $ 118 $ 40 $ 12 $ 193 $ 309 231 $ 289 424 $ 598 27 $ 73 $ 35 $ 135 S 63 $ 198 $ 10 $ 216 $ 226 S 40 20 213 30 6 424 S 97 133 49 279 82 361 10 227 237 598 Sales Cost of Good Sold Gross Profit Overhead Expenses: Deliveries Salaries Warehouse Salaries Sales Salaries Office Salaries Rent Truck Costs Depreciation Payroll Tax Union Pension Plan Utilities Insurance Warehouse Expense Office Supplies Legal & Accounting Dues & Subscriptions Travel & Entertainment Advertising Selling and Promotional Donations Profit Sharing Plan Interest Expense Total Overhead Expenses Net Profit Before Tax Income Tax Net Profit After Tax Expenses by Function: $ $ $ $ $ $ GA GA GA GA GA GA GA GA GA GA GA GA GA $ $ $ $ $ $ $ $ $ $ $ $ 69 69 69 69 69 69 $ $ $ S $ $ Warehouse & Delivery General & Administrative S Selling 696969 $ 2017 2,400 $ 1,836 $ 564 130 C4FQ3581 21 22 $ 69 5 7 $ 20 GALA $ 68 48 $ 18 $ 99 $ GALA 18 $ 17 $ 30 $ GA $ $ 7 $ 4 $ GA GA 3 $ 4 $ $ 26 $ 1 45 7 $ $ $ 507 S 57 $ 15 $ 42 $ 228 $ 96 S 125 S 2018 2,618 $ 3,006 2,014 $ 2,345 604 $ 661 SEKS83 156 $ 29 $ 75 $ 52 $ 18 $ 22 23 21 $ 25 $ 33 $ 6 8 $ $ 23 $ 6 $ 3 $ $ $ $ $ 32 9 29 1 33 $ $ 8 $ 69 563 S 8 33 69 69 69 69 $ $ 2019 325 S 108 S 130 S 186 35 80 55 18 34 22 34 37 8 11 30 15 6 3 7 11 31 1 10 14 648 13 2 11 390 125 146 1. 2. 3. 4. Solvency and Liquidity Ratios Current Ratio: Quick Ratio: Safety Ratio Debt to Worth Ratio: Profitablility Ratios Gross Profit Margin: Net Profit Margin (ROS): Asset Management Ratios Sales to Assets: Return on Assets (ROA): Return on Net Worth (ROE): Inventory Turnover: Inventory Turnover in Days: Accounts Payable Turnover: Accounts Payable in Days: CA/CL (Cash + A/R)/CL TL/Tangible N/W Gross Profit/Sales Net Profit B.T./Sales Sales/Total Assets Net Profit B.T./Total Assets Net Profit B.T./Tangible N/W COGS/Inventory 360/Inventory Turnover COGS/Accounts Payable 360/Acct. Payable Turnover 2017 1.77 0.27 0.77 23.50% 2.38% 7.02 16.70% 29.5% 17 21 26.2 14 2018 1.43 0.17 0.88 23.07% 1.57% 6.17 9.67% 18.1% 17.07 21.09 27.59 13.05 2019 Average Measure 1.7 0.7 Times 1.4 23.00% Percent 4.86% Percent 5.4 Times 10.10% Percent 12.7 26.4% Percent 29 24 Times 15 Times Days Times Days Expense Categories 1. Warehouse & Delivery Exp. 2. Gen. & Admin. Expense Selling Expense 3. Cases/Drivers Information Cases per Driver a Day (260 days) 4. 5. Number of Drivers 6. Number of Cases Sold 2017 9.5% 4.0% 5.2% 340 6 530,400 2018 12.4% 4.1% 5.0% 308 7 560,000 2019 8 620,000 Industry Average Measure 8.5% Percent 4.2% Percent 5.5% Percent 400 Number Number Number
Expert Answer:
Answer rating: 100% (QA)
Table to display the Balance Sheet and Income Statement information provided for Wilson Distributors ... View the full answer

Related Book For 
Managerial Accounting
ISBN: 9780073526706
12th Edition
Authors: Ray H. Garrison, Eric W. Noreen, Peter C. Brewer
Posted Date:
Students also viewed these accounting questions
-
The Wallace Company of Houston is a distributor of pipes, valves, and fittings to the refining, chemical, and petrochemical industries. The company was a recent winner of the Malcolm Baldrige...
-
The Davidson Corporation's balance sheet and income statement are provided here. Davidson Corporation: Income Statement for Year Ending December 31, 2012 (Millions of Dollars)...
-
The Davidson Corporations balance sheet and income statement are provided here. a. Construct the statement of stockholders equity for December 31, 2018. No common stock was issued during 2018. b. How...
-
Compute the indicated quantities for the given homomorphism. Ker () for : S 3 Z 2 in Example 13.3 Data from Example 13.3 Let S n be the symmetric group on n letters, and let : S n Z 2 be defined by...
-
What is a program version number?
-
Use source transformation to find Io in the circuit in figure. ww 4 kn 18 V 36 kn 4 kn 6 kn 6 kn 2 mA( 3 1 mA
-
Do shallow waves propagate at the same speed in all fluids? Explain why or why not.
-
Salina Sports Wear has designed a new athletic suit. The company plans to produce and sell 30,000 units of the new product in the coming year. Annual fixed costs are $600,000, and variable costs are...
-
10. From the following information prepare marginal costing statement and calculate BEP and PVR Fixed cost Ro 120000 Variable cost RO 200000 Sales RO 1000000 Direct wages RO 150000 Direct materials...
-
Enhance the Treasury Yield Rates database file to perform a database query that finds the rate associated with any date and term.
-
Suppliers are powerful in all cases except what ?
-
PDF Given the initial value problem y(3) + 3y" +4y' + 12y = 0 y(0) = a, y'(0) = 0, y"(0) = 0 1. Solve the initial value problem by hand. 2. Solve the same problem using the Matlab or Mathematica and...
-
There are two options P and M. With 15% MARR under 20 years study period, which alternative should be chosen based on the following conditions and why? For P, the initial cost is $14k, the yearly...
-
Nickel and Dime Corp. issued a bond paying 8 percent interest with 15 years to maturity. Assume the current yield to maturity on such bond is 10 percent. What is the price of the bond - assuming...
-
Davis Pizza is analyzing the prospect of purchasing an additional fire-brick oven. The oven costs $200,000 and would be depreciated straight-line to a salvage value of $120,000 in ten years. The...
-
Suppose two firms, Genera Pharma and Futura Pharma, are the only two producers of a specific drug. Genera and Futura have the same formula and sell the drug for the same price, but they are...
-
A prime mover delivers power to a fluid coupling at 140 kW, with a shaft rotating at 1800 rpm, and with a slip of 3%. (a) What is the shaft torque? (b) What is the power flow in the output shaft? (c)...
-
One Way Cellular accountants have assembled the following data for the year ended September 30, 2014: Prepare the operating activities section using the indirect method for One Way Cellulars...
-
What are the four steps in the planning and control cycle?
-
How does opportunity cost enter into the make or buy decision?
-
Why is direct labor a poor base for allocating overhead in many companies?
-
An amorphous material is: (a) Mica (b) Lead (c) Rubber (d) Glass
-
Discuss the application vernier caliper and its method of measurement.
-
In center lathe, cutting tool is fed in ____ directions with reference to the lathe axis.

Study smarter with the SolutionInn App