

1. Let's study whether the presence of 401(k) pension plans increase net savings. The dataset 401KSUBS...
Fantastic news! We've Found the answer you've been seeking!
Question:

![ES AB Edit mode TI Sidebar Save Find inc[6] 15 e401k marr ma le age fsize nettfa p401k pira incse Y1 19 91 1Variables 6 6](https://dsd5zvtm8ll6.cloudfront.net/si.experts.images/questions/2021/11/617fcf7e04d07_1635766141399.jpg)
Transcribed Image Text:
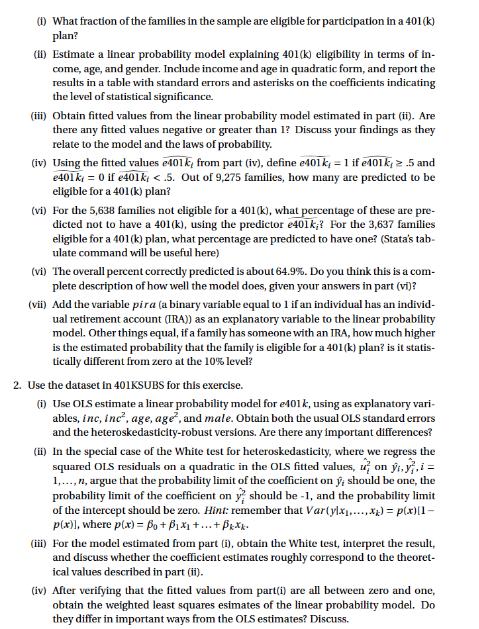
1. Let's study whether the presence of 401(k) pension plans increase net savings. The dataset 401KSUBS contains information on net financial assets (netfa), family income (inc), a binary variable for eligibility in a 401(k) plan (e401k), and several other vari- ables (which are labeled). (1) What fraction of the families in the sample are eligible for participation in a 401(k) plan? (ii) Estimate a linear probability model explaining 401(k) eligibility in terms of in- come, age, and gender. Include income and age in quadratic form, and report the results in a table with standard errors and asterisks on the coefficients indicating the level of statistical significance. (iii) Obtain fitted values from the linear probability model estimated in part (ii). Are there any fitted values negative or greater than 1? Discuss your findings as they relate to the model and the laws of probability. (iv) Using the fitted values e401k, from part (iv), define e401 k, = 1 if e101k, 2.5 and e401k, = 0 if e401k; <.5. Out of 9,275 families, how many are predicted to be eligible for a 401(k) plan? (vi) For the 5,638 families not eligible for a 401(k), what percentage of these are pre- dicted not to have a 401(k), using the predictor e401k;? For the 3,637 families eligible for a 401(k) plan, what percentage are predicted to have one? (Stata's tab- ulate command will be useful here) (vi) The overall percent correctly predicted is about 64.9%. Do you think this is a com- plete description of how well the model does, given your answers in part (vi)? (vii) Add the variable pira (a binary variable equal to 1 if an individual has an individ- ual retirement account (TRA)) as an explanatory variable to the linear probability model. Other things equal, if a family has someone with an IRA, how much higher is the estimated probability that the family is eligible for a 401(k) plan? is it statis- tically different from zero at the 10% level? 2. Use the dataset in 401KSUBS for this exercise. (i) Use OLS estimate a linear probability model for e401k, using as explanatory vari- ables, inc, inc², age, age, and male. Obtain both the usual OLS standard errors and the heteroskedasticity-robust versions. Are there any important differences? (ii) In the special case of the White test for heteroskedasticity, where we regress the squared OLS residuals on a quadratic in the OLS fitted values, on yi,y,i = 1,..., n, argue that the probability limit of the coefficient on y, should be one, the probability limit of the coefficient on y should be -1, and the probability limit of the intercept should be zero. Hint: remember that Var(ylx.....x) = p(x)[1- p(x)], where p(x) = po + B₁x₁ +...+Pkxx. (iii) For the model estimated from part (i), obtain the White test, interpret the result, and discuss whether the coefficient estimates roughly correspond to the theoret- ical values described in part (ii). (iv) After verifying that the fitted values from part(i) are all between zero and one, obtain the weighted least squares esimates of the linear probability model. Do they differ in important ways from the OLS estimates? Discuss. Edit mode 1 2 3 4 5 6 7 8 9 10 11 11 12 13 14 15 16 17 18 19 20 21 22 23 24 25 23 26 20 27 28 29 30 inc[6] e401k 0 1 0 8 0 0 0 0 8 1 0 0 8 0 0 0 1 1 1 0 1 0 0 8 0 0 0 1 0 0 8 a Save Find inc 15 13.17 61.23 12.858 98.88 22.614 15 37.155 31.896 47.295 29.1 23.457 31.785 34.941 24.432 25.131 19.074 38.772 12.48 45.39 39.861 102.6 39.579 40.194 25.254 10.8 27 17.856 38.94 12.24 18 marr 8 a 1 1 1 A 1 1 1 1 9 1 1 1 1 1 0 1 1 1 1 1 1 1 А 0 8 1 1 8 0 male 0 1 8 1 0 0 0 8 A 1 0 0 16 8 8 0 1 8 8 0 A 0 8 8 1 A 1 8 8 1 0 age 40 35 44 44 53 60 49 38 52 45 61 40 48 co 60 43 43 47 27 57 35 53 36 40 31 48 42 42 35 32 46 fsize 1 1 2 2 1 3 5 5 2 1 3 6 3 2 5 1 2 2 2 2 5 4 3 1 2 1 5 2 2 2 nettfa 4.575 154 8 21.8 18.45 8 3.483 -2.1 5.29 29.6 0 18.149 .695 .2 -4.25 8 4.15 -10 122.5 1.6 40.999 12.175 8.3 9.687 .5 .13 -15.495 .2 -2.5 0 p401k 0 1 8 8 ទ 0 0 8 0 8 0 D 8 8 8 0 0 1 8 0 0 1 8 8 8 0 0 8 1 0 0 pira 1 0 0 0 0 0 1 1380.494 1017.355 2236.817 846.81 550.2309 1010.286 1220.874 596.9226 A 0 0 0 631.5672 0 363.8174 0 1503.268 0 155.7504 2060.252 1588.899 10526.76 1566.497 1615.558 637.7645 116.64 729 318.8368 1516.323 149.8176 324 0 1 1 0 A 0 1 1 1 0 1 1 0 0 0 0 incsq 173.4489 3749.113 165.3282 9777.254 511.393 225 1 1 agesq 1600 1225 1936 1936 2809 3600 2401 1444 2704 2025 3721 1600 2304 3600 1849 1849 2209 729 3249 1225 2809 1296 1600 961 2304 1764 1764 1225 1024 2116 Variables Name e401k inc marr male male age fsize nettfa p401k pira incsq agesq Q- Properties Variables Name Label Type Format Value label Notes ▼ Data Frame ►Filename E OY default 401ksubs.dta Sidebar Label =1 if eligble for 401(k) annual income, $10... =1 if married =1 if male respondent in years inc annual income, $1000s float %9.0g family size net total fin. assets,... =1 if participate in 4... =1 if have IRA inc^2 age^2 AE 1. Let's study whether the presence of 401(k) pension plans increase net savings. The dataset 401KSUBS contains information on net financial assets (netfa), family income (inc), a binary variable for eligibility in a 401(k) plan (e401k), and several other vari- ables (which are labeled). (1) What fraction of the families in the sample are eligible for participation in a 401(k) plan? (ii) Estimate a linear probability model explaining 401(k) eligibility in terms of in- come, age, and gender. Include income and age in quadratic form, and report the results in a table with standard errors and asterisks on the coefficients indicating the level of statistical significance. (iii) Obtain fitted values from the linear probability model estimated in part (ii). Are there any fitted values negative or greater than 1? Discuss your findings as they relate to the model and the laws of probability. (iv) Using the fitted values e401k, from part (iv), define e401 k, = 1 if e101k, 2.5 and e401k, = 0 if e401k; <.5. Out of 9,275 families, how many are predicted to be eligible for a 401(k) plan? (vi) For the 5,638 families not eligible for a 401(k), what percentage of these are pre- dicted not to have a 401(k), using the predictor e401k;? For the 3,637 families eligible for a 401(k) plan, what percentage are predicted to have one? (Stata's tab- ulate command will be useful here) (vi) The overall percent correctly predicted is about 64.9%. Do you think this is a com- plete description of how well the model does, given your answers in part (vi)? (vii) Add the variable pira (a binary variable equal to 1 if an individual has an individ- ual retirement account (TRA)) as an explanatory variable to the linear probability model. Other things equal, if a family has someone with an IRA, how much higher is the estimated probability that the family is eligible for a 401(k) plan? is it statis- tically different from zero at the 10% level? 2. Use the dataset in 401KSUBS for this exercise. (i) Use OLS estimate a linear probability model for e401k, using as explanatory vari- ables, inc, inc², age, age, and male. Obtain both the usual OLS standard errors and the heteroskedasticity-robust versions. Are there any important differences? (ii) In the special case of the White test for heteroskedasticity, where we regress the squared OLS residuals on a quadratic in the OLS fitted values, on yi,y,i = 1,..., n, argue that the probability limit of the coefficient on y, should be one, the probability limit of the coefficient on y should be -1, and the probability limit of the intercept should be zero. Hint: remember that Var(ylx.....x) = p(x)[1- p(x)], where p(x) = po + B₁x₁ +...+Pkxx. (iii) For the model estimated from part (i), obtain the White test, interpret the result, and discuss whether the coefficient estimates roughly correspond to the theoret- ical values described in part (ii). (iv) After verifying that the fitted values from part(i) are all between zero and one, obtain the weighted least squares esimates of the linear probability model. Do they differ in important ways from the OLS estimates? Discuss. Edit mode 1 2 3 4 5 6 7 8 9 10 11 11 12 13 14 15 16 17 18 19 20 21 22 23 24 25 23 26 20 27 28 29 30 inc[6] e401k 0 1 0 8 0 0 0 0 8 1 0 0 8 0 0 0 1 1 1 0 1 0 0 8 0 0 0 1 0 0 8 a Save Find inc 15 13.17 61.23 12.858 98.88 22.614 15 37.155 31.896 47.295 29.1 23.457 31.785 34.941 24.432 25.131 19.074 38.772 12.48 45.39 39.861 102.6 39.579 40.194 25.254 10.8 27 17.856 38.94 12.24 18 marr 8 a 1 1 1 A 1 1 1 1 9 1 1 1 1 1 0 1 1 1 1 1 1 1 А 0 8 1 1 8 0 male 0 1 8 1 0 0 0 8 A 1 0 0 16 8 8 0 1 8 8 0 A 0 8 8 1 A 1 8 8 1 0 age 40 35 44 44 53 60 49 38 52 45 61 40 48 co 60 43 43 47 27 57 35 53 36 40 31 48 42 42 35 32 46 fsize 1 1 2 2 1 3 5 5 2 1 3 6 3 2 5 1 2 2 2 2 5 4 3 1 2 1 5 2 2 2 nettfa 4.575 154 8 21.8 18.45 8 3.483 -2.1 5.29 29.6 0 18.149 .695 .2 -4.25 8 4.15 -10 122.5 1.6 40.999 12.175 8.3 9.687 .5 .13 -15.495 .2 -2.5 0 p401k 0 1 8 8 ទ 0 0 8 0 8 0 D 8 8 8 0 0 1 8 0 0 1 8 8 8 0 0 8 1 0 0 pira 1 0 0 0 0 0 1 1380.494 1017.355 2236.817 846.81 550.2309 1010.286 1220.874 596.9226 A 0 0 0 631.5672 0 363.8174 0 1503.268 0 155.7504 2060.252 1588.899 10526.76 1566.497 1615.558 637.7645 116.64 729 318.8368 1516.323 149.8176 324 0 1 1 0 A 0 1 1 1 0 1 1 0 0 0 0 incsq 173.4489 3749.113 165.3282 9777.254 511.393 225 1 1 agesq 1600 1225 1936 1936 2809 3600 2401 1444 2704 2025 3721 1600 2304 3600 1849 1849 2209 729 3249 1225 2809 1296 1600 961 2304 1764 1764 1225 1024 2116 Variables Name e401k inc marr male male age fsize nettfa p401k pira incsq agesq Q- Properties Variables Name Label Type Format Value label Notes ▼ Data Frame ►Filename E OY default 401ksubs.dta Sidebar Label =1 if eligble for 401(k) annual income, $10... =1 if married =1 if male respondent in years inc annual income, $1000s float %9.0g family size net total fin. assets,... =1 if participate in 4... =1 if have IRA inc^2 age^2 AE
Expert Answer:
Answer rating: 100% (QA)
Question 1 Answer Question 2 Answer 1 About 392 or 392 are eligible for a 401k plan 2 The estimated ... View the full answer

Related Book For 

Introductory Econometrics A Modern Approach
ISBN: 978-0324660548
4th edition
Authors: Jeffrey M. Wooldridge
Posted Date:
Students also viewed these mathematics questions
-
A cluster complex, Mn 4 O 4 (L) 6 (L = [P(O t Bu) 2 O 2 ]), was reported by Van Allsburg, et al. in Chem. Eur. J. 2015, 21, 4646. What is the average oxidation state of Mn is this complex? Show your...
-
There has been much interest in whether the presence of 401(k) pension plans, available to many U.S. workers, increases net savings. The data set 401KSUBS.RAW contains information on net financial...
-
1. Use logistic-regression methods to assess whether the presence of biliary secretions during the second period is related to dose of hormone used during the second period (do separate analyses for...
-
Cost-Volume-Profit (CVP) analysis can be used to determine the effect of changes in costs and volumes on a company's net profits. This project assignment assumes that you are newly hired as an...
-
Monique is planning to increase the size of the manufacturing business that she operates as a sole proprietorship. She has a number of older assets that she will replace as part of the expansion. In...
-
Jake loaned his cousin, Arnold, $10,000 in March 2016 to open a cybercafe in Santa Barbara. Arnold signed a loan agreement to pay Jake 7% interest annually, with the principal due in 2019. Jake...
-
The block is made of titanium Ti-6A1-4V and is subjected to a shortening of 0.06 in. along the y axis, and its shape is given a tilt of =89.7. Determine x , y , and Y xy . 4 in. 8 A 5 in.
-
An automatic filling machine is used to fill 1- liter bottles of cola. The machines output is approximately normal with a mean of 1.0 liter and a standard deviation of .01 liter. Output is monitored...
-
Timberly Construction makes a lump-sum purchase of several assets on January 1 at a total cash price of $820,000. The estimated market values of the purchased assets are building, $470,000; land,...
-
Merchant Company had the following foreign currency transactions: 1. On November 1, 20X6, Merchant sold goods to a company located in Munich, Germany. The receivable was to be settled in European...
-
By this time, you should have installed and are familiar yourselves with wireshark/tcpdump or equivalent packet sniffers. In this assignment, you will need to capture the network traffic while you...
-
Question 1 Briefly describe three (3) theories of innovation . Answer: (please answer in as much own word as possible) Question 2 Describe the context for innovation in the workplace, including: core...
-
Panera Coffee has a beta of 0.86. The risk-free rate of return is 3.3 percent and the market rate of return is 12.0 percent. What is the risk premium on this stock?
-
Honeycomb has two shareholders Hannah 70% and Harry, 30%. It distributes the following assets in a complete liquidation: land to ( Harry) FMV $150,000, basis $120,000. Inventory to (Hannah) FMV...
-
What are some of the issues and challenges related to digital, mobile, and social technology assessments that should be considered about creating online training assessments?
-
Topic for Discussion : Describe how HRD is linked to the overall goals and strategies of an organization; identify the major external and internal factors that influence employee behavior. Human...
-
Only two forces act on an object (mass-2.30 kg), as in the drawing. Find (a) the magnitude and (b) the direction (relative to the x axis) of the acceleration of the object. (a) Number i Units (b)...
-
An example of prescriptive analytics is when an action is recommended based on previously observed actions. For example, an analysis might help determine procedures to follow when new accounts are...
-
Use the data in APPLE.RAW to answer this question. (i) Define a binary variable as ecobuy = 1 if ecolbs > 0 and ecobuy = 0 if ecolbs = 0. In other words, ecobuy indicates whether, at the prices...
-
Are rent rates influenced by the student population in a college town? Let rent be the average monthly rent paid on rental units in a college town in the United States. Let pop denote the total city...
-
Consider a simple time series model where the explanatory variable has classical measurement error: where ut has zero mean and is uncorrelated with x*t, and et. We observe yt and xt only. Assume that...
-
Refer to Exercise 7.12. (a) Obtain the maximum likelihood estimates of \(\mu\) and \(\sigma\). (b) Find the maximum likelihood of the probability that the next run will have a production greater than...
-
A statistical test of hypotheses includes the step of setting a maximum for the probability of falsely rejecting the null hypothesis. Engineers make many measurements on critical bridge components to...
-
A manufacturer wants to establish that the mean life of a gear when used in a crusher is over 55 days. The data will consist of how long gears in 80 different crushers have lasted. (a) Formulate the...

Study smarter with the SolutionInn App