You are assigned the task of deciding how many tellers to employ for the 11:30-12:00 slot on
Question:
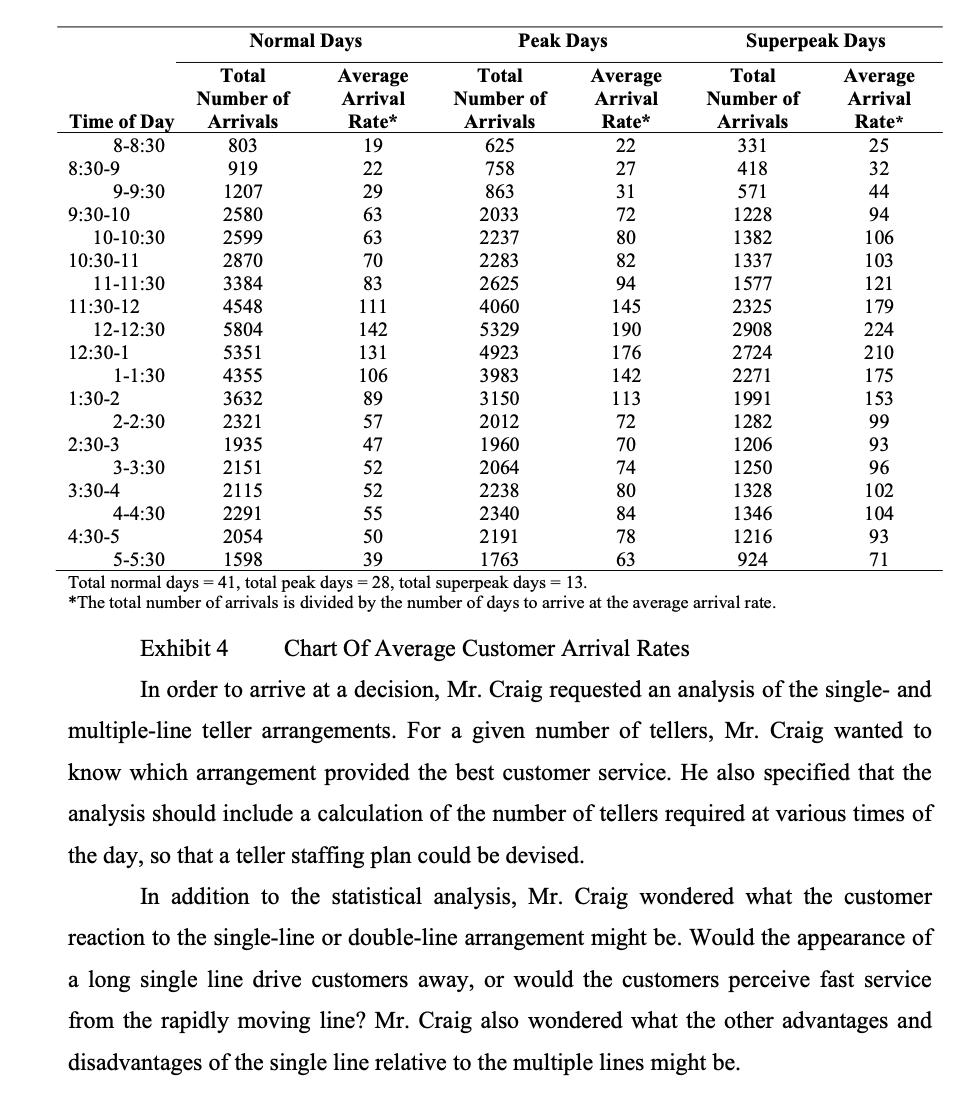
You are assigned the task of deciding how many tellers to employ for the 11:30-12:00 slot on a normal day. Assume that the cost of using a teller for an hour is $40. It is clear that customers are not happy to wait – in order to quantify economically the pain of waiting, you have been asked to value a customer’s time at the rate of $300 per hour – that is, if a customer waits for 6 minutes (0.1 hours) in the queue (not including the service time), this waiting time is equivalent to the customer incurring a cost of $30. Also, assume that the single line teller arrangement of Exhibit 1 is used. Find the optimal number of tellers to employ for this half an hour slot – your objective is to minimize the total cost of hiring some number of tellers plus the total expected waiting time costs for the customers. What is the utilization when this number of tellers is used?
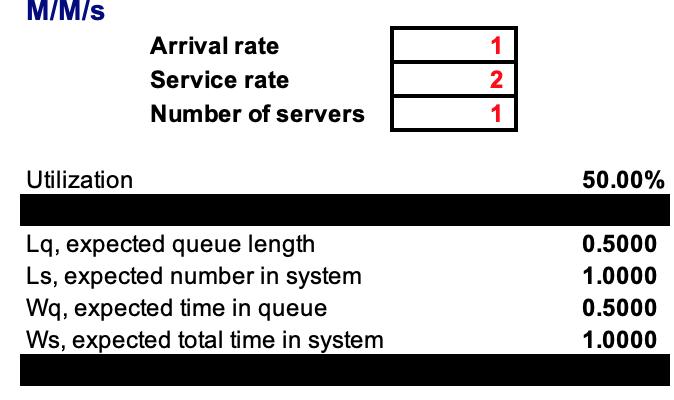
1. The spreadsheet requires 3 inputs, an arrival rate, a service rate and the number of servers. The first two inputs should be gathered from the data. The number of servers is our decision which you can vary.
2. The service rate and arrival rate should both be expressed in the same units, for example customers per hour or customers per half-hour. If you choose to express them in customers per hour, then the expected waiting time that you see on the spreadsheet is the expected waiting time in hours. If you choose to express them in customers per half-hour, then the expected waiting time that you see on the spreadsheet is the expected waiting time in half-hours (for example, if the spreadsheet says the expected waiting time is 2.2, then, it means that the expected waiting time is 1.1 hours in this case).
3. The average service time is given in the case. The service rate is the reciprocal of this. 4. The average arrival rate given in Exhibit 4 is the average arrival rate in customers per half-hour.
Expert Answer: