

You are given the following search space: State A A B B C C C D...
Fantastic news! We've Found the answer you've been seeking!
Question:
Transcribed Image Text:
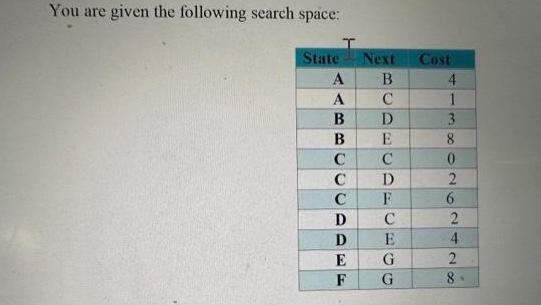
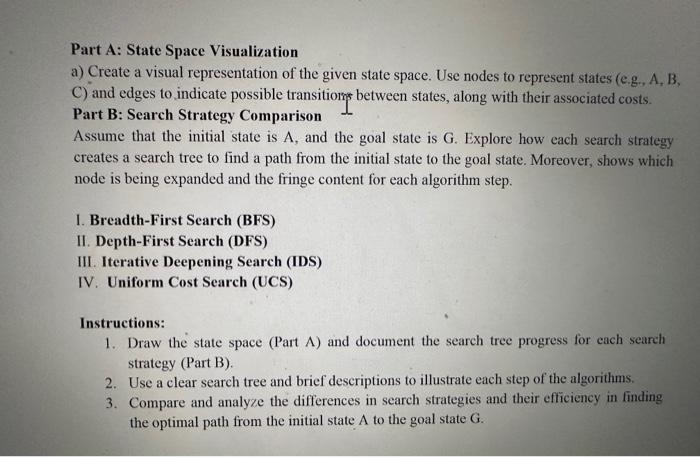
You are given the following search space: State A A B B C C C D D E F Next B C D E C D F C E G G Cost 4 1 3 8 0 2 6 2428 8. Part A: State Space Visualization a) Create a visual representation of the given state space. Use nodes to represent states (e.g., A, B, C) and edges to indicate possible transitions between states, along with their associated costs. Part B: Search Strategy Comparison Assume that the initial state is A, and the goal state is G. Explore how each search strategy creates a search tree to find a path from the initial state to the goal state. Moreover, shows which node is being expanded and the fringe content for each algorithm step. 1. Breadth-First Search (BFS) II. Depth-First Search (DFS) III. Iterative Deepening Search (IDS) IV. Uniform Cost Search (UCS) Instructions: 1. Draw the state space (Part A) and document the search tree progress for each search strategy (Part B). 2. Use a clear search tree and brief descriptions to illustrate each step of the algorithms. 3. Compare and analyze the differences in search strategies and their efficiency in finding the optimal path from the initial state A to the goal state G. You are given the following search space: State A A B B C C C D D E F Next B C D E C D F C E G G Cost 4 1 3 8 0 2 6 2428 8. Part A: State Space Visualization a) Create a visual representation of the given state space. Use nodes to represent states (e.g., A, B, C) and edges to indicate possible transitions between states, along with their associated costs. Part B: Search Strategy Comparison Assume that the initial state is A, and the goal state is G. Explore how each search strategy creates a search tree to find a path from the initial state to the goal state. Moreover, shows which node is being expanded and the fringe content for each algorithm step. 1. Breadth-First Search (BFS) II. Depth-First Search (DFS) III. Iterative Deepening Search (IDS) IV. Uniform Cost Search (UCS) Instructions: 1. Draw the state space (Part A) and document the search tree progress for each search strategy (Part B). 2. Use a clear search tree and brief descriptions to illustrate each step of the algorithms. 3. Compare and analyze the differences in search strategies and their efficiency in finding the optimal path from the initial state A to the goal state G. You are given the following search space: State A A B B C C C D D E F Next B C D E C D F C E G G Cost 4 1 3 8 0 2 6 2428 8. Part A: State Space Visualization a) Create a visual representation of the given state space. Use nodes to represent states (e.g., A, B, C) and edges to indicate possible transitions between states, along with their associated costs. Part B: Search Strategy Comparison Assume that the initial state is A, and the goal state is G. Explore how each search strategy creates a search tree to find a path from the initial state to the goal state. Moreover, shows which node is being expanded and the fringe content for each algorithm step. 1. Breadth-First Search (BFS) II. Depth-First Search (DFS) III. Iterative Deepening Search (IDS) IV. Uniform Cost Search (UCS) Instructions: 1. Draw the state space (Part A) and document the search tree progress for each search strategy (Part B). 2. Use a clear search tree and brief descriptions to illustrate each step of the algorithms. 3. Compare and analyze the differences in search strategies and their efficiency in finding the optimal path from the initial state A to the goal state G. You are given the following search space: State A A B B C C C D D E F Next B C D E C D F C E G G Cost 4 1 3 8 0 2 6 2428 8. Part A: State Space Visualization a) Create a visual representation of the given state space. Use nodes to represent states (e.g., A, B, C) and edges to indicate possible transitions between states, along with their associated costs. Part B: Search Strategy Comparison Assume that the initial state is A, and the goal state is G. Explore how each search strategy creates a search tree to find a path from the initial state to the goal state. Moreover, shows which node is being expanded and the fringe content for each algorithm step. 1. Breadth-First Search (BFS) II. Depth-First Search (DFS) III. Iterative Deepening Search (IDS) IV. Uniform Cost Search (UCS) Instructions: 1. Draw the state space (Part A) and document the search tree progress for each search strategy (Part B). 2. Use a clear search tree and brief descriptions to illustrate each step of the algorithms. 3. Compare and analyze the differences in search strategies and their efficiency in finding the optimal path from the initial state A to the goal state G. You are given the following search space: State A A B B C C C D D E F Next B C D E C D F C E G G Cost 4 1 3 8 0 2 6 2428 8. Part A: State Space Visualization a) Create a visual representation of the given state space. Use nodes to represent states (e.g., A, B, C) and edges to indicate possible transitions between states, along with their associated costs. Part B: Search Strategy Comparison Assume that the initial state is A, and the goal state is G. Explore how each search strategy creates a search tree to find a path from the initial state to the goal state. Moreover, shows which node is being expanded and the fringe content for each algorithm step. 1. Breadth-First Search (BFS) II. Depth-First Search (DFS) III. Iterative Deepening Search (IDS) IV. Uniform Cost Search (UCS) Instructions: 1. Draw the state space (Part A) and document the search tree progress for each search strategy (Part B). 2. Use a clear search tree and brief descriptions to illustrate each step of the algorithms. 3. Compare and analyze the differences in search strategies and their efficiency in finding the optimal path from the initial state A to the goal state G. You are given the following search space: State A A B B C C C D D E F Next B C D E C D F C E G G Cost 4 1 3 8 0 2 6 2428 8. Part A: State Space Visualization a) Create a visual representation of the given state space. Use nodes to represent states (e.g., A, B, C) and edges to indicate possible transitions between states, along with their associated costs. Part B: Search Strategy Comparison Assume that the initial state is A, and the goal state is G. Explore how each search strategy creates a search tree to find a path from the initial state to the goal state. Moreover, shows which node is being expanded and the fringe content for each algorithm step. 1. Breadth-First Search (BFS) II. Depth-First Search (DFS) III. Iterative Deepening Search (IDS) IV. Uniform Cost Search (UCS) Instructions: 1. Draw the state space (Part A) and document the search tree progress for each search strategy (Part B). 2. Use a clear search tree and brief descriptions to illustrate each step of the algorithms. 3. Compare and analyze the differences in search strategies and their efficiency in finding the optimal path from the initial state A to the goal state G.
Expert Answer:

Related Book For 

Income Tax Fundamentals 2013
ISBN: 9781285586618
31st Edition
Authors: Gerald E. Whittenburg, Martha Altus Buller, Steven L Gill
Posted Date:
Students also viewed these programming questions
-
A mechanically polished stainless steel pan with a diameter of 30 cm is filled with water and placed on top of the heating unit. The top surface of the water is exposed to ambient air at 1 atm...
-
The following additional information is available for the Dr. Ivan and Irene Incisor family from Chapters 1-5. Ivan's grandfather died and left a portfolio of municipal bonds. In 2012, they pay Ivan...
-
The following additional information is available for the Dr. Ivan and Irene Incisor family from Chapters 1-6. On December 12, Irene purchased the building where her store is located. She paid...
-
Charles has a savings account with a balance, today, of 100,000 SAR in his investment account. He expects to obtain a yearly return of 12% in his investments. How long will it take for Charles to...
-
For 2014 and 2015, compute the four ratios that measure the ability to earn profits for Fabulous Fashions, Inc., whose comparative income statement follows: Additional data follow: Requirement 1. Did...
-
The European Division of Worldwide Reference Corporation produces a pocket dictionary containing popular phrases in six European languages. Annual budget data for the coming year follow. Projected...
-
What is a logical interface?
-
Shao Industries is considering a proposed project for its capital budget. The company estimates that the project's NPV is $12 million. This estimate assumes that the economy and market conditions...
-
The company produces and sells two products X and Y at a sale price of 1 0 0 and 3 0 0 respectively. Production and processes ( a ) During production, each product undergoes two processes, ' A ' and...
-
Using the predictions made by the model on the "Prediction data (this year, active donors)" data set, if the Gabriel Hansen Foundation did not change its direct marketing strategy at all, and sent...
-
what ways do cultural practices, rituals, and traditions serve as mechanisms for social cohesion and identity formation within communities, while also contributing to the maintenance of social...
-
Indicate whether each of the following statements is true or false by writing T or F in t he a nswer c olumn. An airbill is similar to a bill of lading except that it covers a shipment made by air.
-
Indicate whether each of the following statements is true or false by writing T or F in the answer c olumn. Once a person delegates a contractual duty, he or she no longer has responsibility under...
-
Discuss the implications of a government policy that any network that intends to cover the Olympics must devote equal air time to mens and womens events.
-
Indicate whether each of the following statements is true or false by writing T or F in the answer c olumn. Some assignments are prohibited by public policy.
-
If implementing Title IX means that mens sports must experience a reduction in funding, should it be eliminated?
-
The data from a certain flue gas analysis are as follows: The original volume of the sample was 100 ml Volume after passing through KOH solution 87.9 ml Volume after passing through alkaline...
-
The figure shows six containers, each of which is filled from the top. Assume that water is poured into the containers at a constant rate and each container is filled in 10 seconds. Assume also that...
-
While preparing Massie Miller's 2012 Schedule A, you review the following list of possible charitable deductions provided by Massie: Cash contribution to a family whose house burned...
-
John Fuji (age 37) moved from California to Washington in December 2011. He lives at 468 Cameo Street, Yakima, WA 98901. John's Social Security number is 571-78-5974 and he is single. His earnings...
-
For each of the following cases, indicate the filing status for the taxpayer(s) for 2012 using the following legend: A - Single B - Married, filing a joint return C - Married, filing separate returns...
-
Derive the equations of motion, using Newton's second law of motion, for each of the systems shown in Figs. 6.20. 000 x(t) F(t) 21 31 Rigid bar, mass - 2m A G k X3(1) F3(1) 5m x2(1) F2(t) FIGURE 6.20...
-
A car is modeled as shown in Fig. 6.23. Derive the equations of motion using Newton's second law of motion. Figure 6.23:- x(t) F(t) 21 31 Rigid bar, mass- 2m A G X3(1) F3(t) 5m x2(1) F(t) FIGURE 6.20...
-
The equations of motion derived using the displacements of the masses, \(x_{1}, x_{2}\), and \(x_{3}\) as degrees of freedom in Fig. 6.12 (Example 6.10) lead to symmetric mass and stiffness matrices...

Study smarter with the SolutionInn App