Answered step by step
Verified Expert Solution
Question
1 Approved Answer
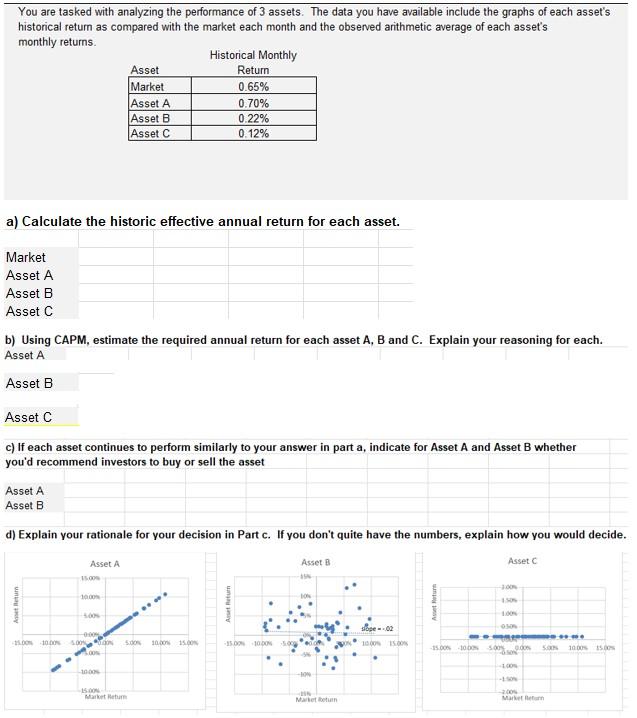
You are tasked with analyzing the performance of 3 assets. The data you have available include the graphs of each asset's historical return as

You are tasked with analyzing the performance of 3 assets. The data you have available include the graphs of each asset's historical return as compared with the market each month and the observed arithmetic average of each asset's monthly returns. Historical Monthly Market Asset A Asset B Asset C a) Calculate the historic effective annual return for each asset. b) Using CAPM, estimate the required annual return for each asset A, B and C. Explain your reasoning for each. Asset A Asset B Asset A Asset B Asset C c) If each asset continues to perform similarly to your answer in part a, indicate for Asset A and Asset B whether you'd recommend investors to buy or sell the asset A Return d) Explain your rationale for your decision in Part c. If you don't quite have the numbers, explain how you would decide. Asset A 15.00 10.00% 15.00% -10.00% 4.00% Asset Market Asset A Asset B Asset C 00% 1000 Return 0.65% 0.70% 0.22% 0.12% 5.00% 10.00% 15.00% 15.00% Market Return Aset Return -15.00% 100% 100 . Asset B -10% IN Market betur slope--02 1000% 15.00% Asset Return Asset C -100% -15.00% 10.00% 5.00% 0.00% SON -2.00% Market Return ***** 10.00% 15.00%
Step by Step Solution
There are 3 Steps involved in it
Step: 1
a To calculate the historic effective annual return for each asset we can use the following formula ...
Get Instant Access to Expert-Tailored Solutions
See step-by-step solutions with expert insights and AI powered tools for academic success
Step: 2

Step: 3

Ace Your Homework with AI
Get the answers you need in no time with our AI-driven, step-by-step assistance
Get Started


