

Sales staff: 2 positions, $40,000 annual salary each [including superannuation]. Office furniture: Cost $75,000; expected residual
Question:
- · Sales staff: 2 positions, $40,000 annual salary each [including superannuation].
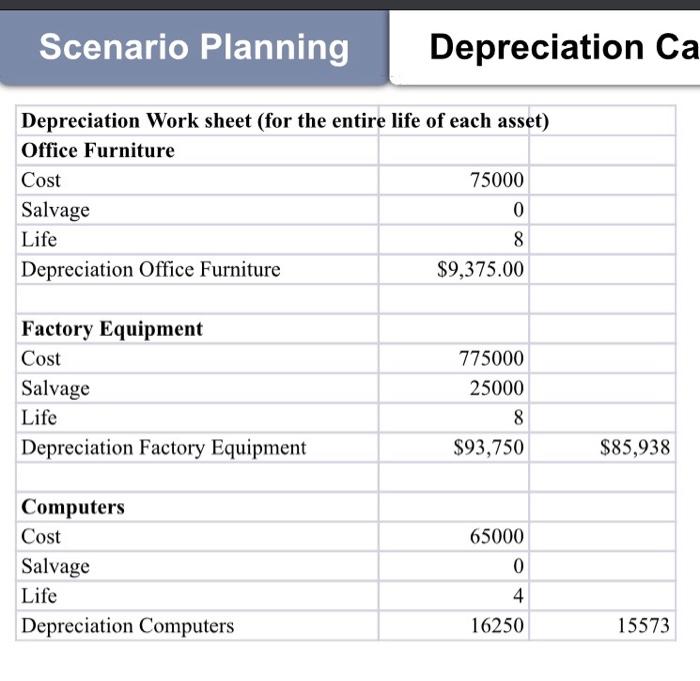
- · Office furniture: Cost $75,000; expected residual $0; useful life 8 years; depreciation method straight-line; installed on 1 July 2020.
- · Factory equipment: Cost $775,000; expected residual $25,000; useful life 8 years; depreciation method straight-line; installed ready for use 31 July 2020.
- · Computers: Cost $65,000; expected residual $0; useful life 4 years; depreciation method reducing balance; installed ready for use 15 July 2020.
- Question Part B
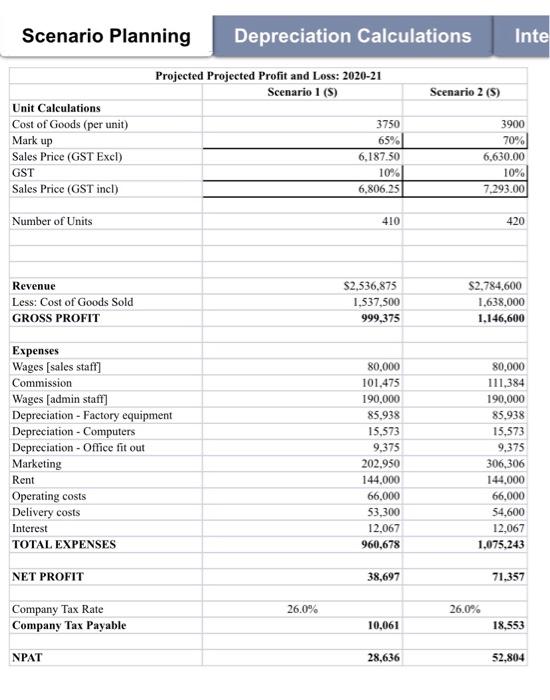
- 1) Advise your client on which scenario should be selected. Explain and justify why you would advise this selection
- 2)Comment on any variances between the scenarios
- 3) Explain the difference between straight-line depreciation and reducing balance depreciation to your clients
- 4) Prepare break-even analysis on the scenario you recommended in part B[1] above:
- a. Calculate the break even analysis mathematically.
- b. Show the break even analysis graphically.
- c. Explain break-even analysis and why it is an important tool for business.
- 5) Produce a Pie Graph showing the break-up of all expenses in the under the scenario recommended in part B[1] above. Comment on the pie graph
- 6) From your analysis provide your recommendation to the client with supporting evidence.
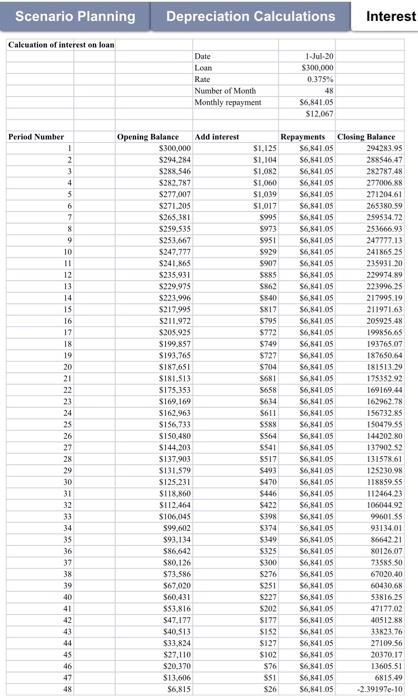
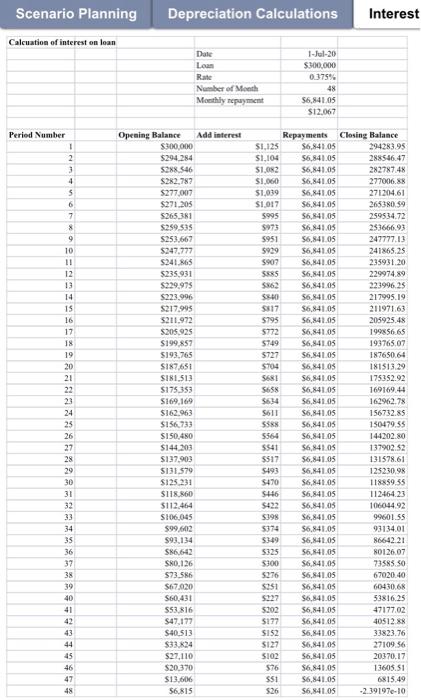
Loan from Big Bank
Banana Industries will borrow $300,000 at 4.5% p.a. compounding monthly. Repayments will be made each month, over a four-year loan term. The loan start date will be 1 July 2020.
Scenario #2
The marketing department at Banana Industries believes that by selling a slightly higher quality webcam system, a higher price and mark-up would be acceptable in the market. They have estimated that with an increased cost per unit [$3900] a mark-up of 70% would be achievable. To support this price increase, marketing and advertising expenditure would increase from 8% to 11%. Annual sales are expected to increase by 10 units compared to scenario #1.
Task to do
I have already done part a excel work. If any one can help me in part B.
Expert Answer:
Solution Part B 1 Scenario 2 has to be selected as it increases NPAT from 28636 to 52804 This increase is due to the decision by the managent to focus on higher quality webcams This results in increas... View the full answer


Accounting What the Numbers Mean
ISBN: 978-1259535314
11th edition
Authors: David Marshall, Wayne McManus, Daniel Viele
