

You know that the production function in a specific industry is: [ Y_{i}=phi^{alpha_{0}} L_{i}^{alpha_{1}} e^{epsilon_{i}} ] Where
Fantastic news! We've Found the answer you've been seeking!
Question:
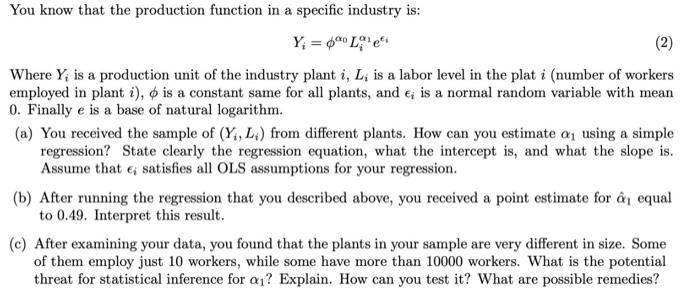
You know that the production function in a specific industry is: [ Y_{i}=phi^{alpha_{0}} L_{i}^{alpha_{1}} e^{epsilon_{i}} ] Where ( Y_{i} ) is a production unit of the industry plant ( i, L_{i} ) is a labor level in the plat ( i ) (number of workers employed in plant ( i), phi ) is a constant same for all plants, and ( epsilon_{i} ) is a normal random variable with mean 0 . Finally ( e ) is a base of natural logarithm. (a) You received the sample of ( left(Y_{i}, L_{i} ight) ) from different plants. How can you estimate ( alpha_{1} ) using a simple regression? State clearly the regression equation, what the intercept is, and what the slope is. Assume that ( epsilon_{i} ) satisfies all OLS assumptions for your regression. (b) After running the regression that you described above, you received a point estimate for ( hat{alpha}_{1} ) equal to 0.49 . Interpret this result. (c) After examining your data, you found that the plants in your sample are very different in size. Some of them employ just 10 workers, while some have more than 10000 workers. What is the potential threat for statistical inference for ( alpha_{1} ) ? Explain. How can you test it? What are possible remedies?
Expert Answer:

Posted Date:
