

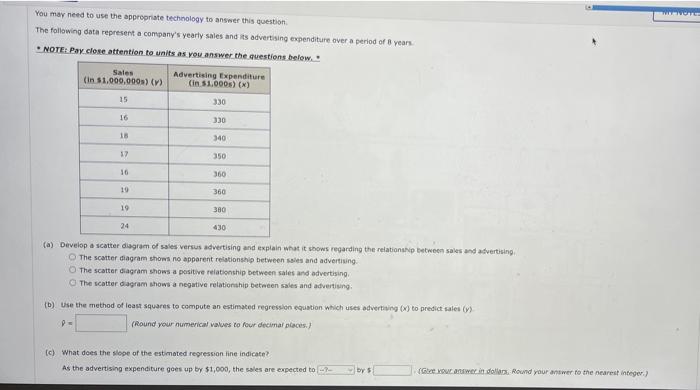
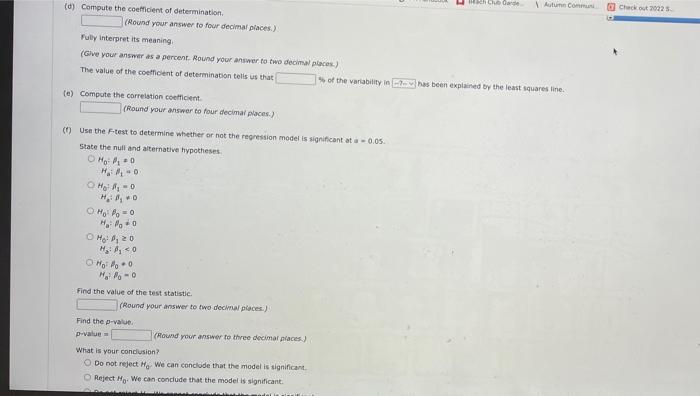
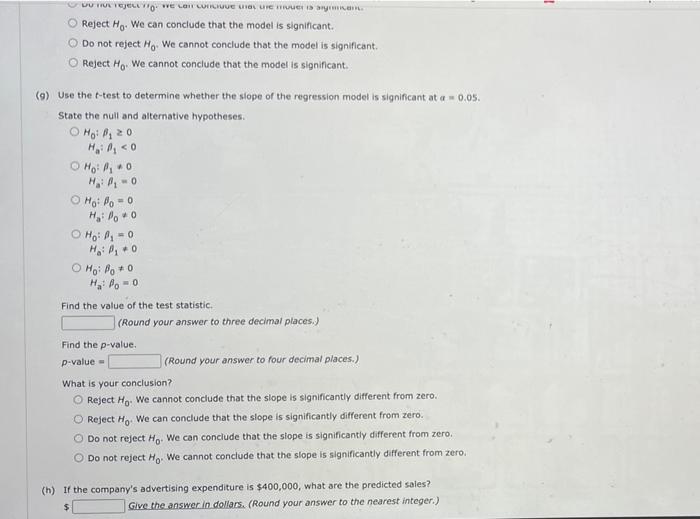
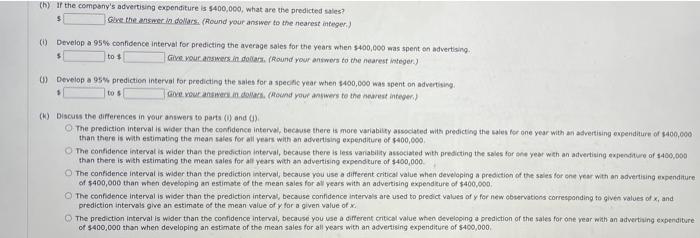
You may need to use the appropriate technology to answer this question. The following data represent...
Fantastic news! We've Found the answer you've been seeking!
Question:
Transcribed Image Text:
You may need to use the appropriate technology to answer this question. The following data represent a company's yearly sales and its advertising expenditure over a period of 8 years NOTE: Pay close attention to units as you answer the questions below. Sales (in $1,000,000s) (v) 15 16 18 16 19 19 24 Advertising Expenditure (in $1.000s) (x) 330 330 340 350 360 360 380 430 (a) Develop a scatter diagram of sales versus advertising and explain what it shows regarding the relationship between sales and advertising. The scatter diagram shows no apparent relationship between sales and advertising. O The scatter diagram shows a positive relationship between sales and advertising. The scatter diagram shows a negative relationship between sales and advertising. (b) Use the method of least squares to compute an estimated regression equation which uses advertising (x) to predict sales (y) P= (Round your numerical values to four decimal places) (c) What does the slope of the estimated regression line indicate? As the advertising expenditure goes up by $1,000, the sales are expected to by s (Give your answer in dollars, Round your answer to the nearest integer.) THE TOTES (d) Compute the coefficient of determination. (Round your answer to four decimal places) Fully interpret its meaning. (Give your answer as a percent. Round your answer to two decimal places) The value of the coefficient of determination tells us that (e) Compute the correlation coefficient. (Round your answer to four decimal places) (f) Use the F-test to determine whether or not the regression model is significant at a -0.05. State the null and alternative hypotheses. ⒸHO:₂0 H: 0 ⒸH₂:₂=0 H₂: ₂0 Ho: Po=0 H₂:0 ⒸHg² By zo H₂: A₁ <0 ⒸHOO Halo-o Find the value of the test statistic. (Round your answer to two decimal places) Find the p-value. p-value= (Round your answer to three decimal places) What is your conclusion? Do not reject Ho We can conclude that the model is significant. O Reject Ho. We can conclude that the model is significant. Beach Club Garde Autumn Communi % of the variability in 7 has been explained by the least squares line. Check out 2022 5 DU TRUL TEJELLTO E LOIT CUIUue unas une nouer is anymian O Reject Ho. We can conclude that the model is significant. Do not reject Ho. We cannot conclude that the model is significant. O Reject Ho. We cannot conclude that the model is significant. (9) Use the f-test to determine whether the slope of the regression model is significant at a = 0.05. State the null and alternative hypotheses. Hoi A₁ 20 H₂: A₁ <0 Ho: P₁0 H₂:₁0 Ho: Po=0 H₂: Do 0 Ho: ₁0 Ho: P₁0 O Ho: Po * 0 H₂: Po=0 Find the value of the test statistic. (Round your answer to three decimal places.) Find the p-value. p-value= (Round your answer to four decimal places.) What is your conclusion? O Reject Ho. We cannot conclude that the slope is significantly different from zero. O Reject Ho. We can conclude that the slope is significantly different from zero. Do not reject Ho. We can conclude that the slope is significantly different from zero. O Do not reject Ho. We cannot conclude that the slope is significantly different from zero. (h) If the company's advertising expenditure is $400,000, what are the predicted sales? Give the answer in dollars. (Round your answer to the nearest integer.) $ (h) If the company's advertising expenditure is $400,000, what are the predicted sales? Give the answer in dollars. (Round your answer to the nearest integer.) (1) Develop a 95% confidence interval for predicting the average sales for the years when $400,000 was spent on advertising. Give your answers in dollars. (Round your answers to the nearest integer.) to $ (1) Develop a 95% prediction interval for predicting the sales for a specific year when $400,000 was spent on advertising. Give your answers in dollars. (Round your answers to the nearest integer.) to $ (K) Discuss the differences in your answers to parts (1) and (3) O The prediction interval is wider than the confidence interval, because there is more variability associated with predicting the sales for one year with an advertising expenditure of $400,000 than there is with estimating the mean sales for all years with an advertising expenditure of $400,000 The confidence interval is wider than the prediction interval, because there is less variability associated with predicting the sales for one year with an advertising expenditure of $400,000 than there is with estimating the mean sales for all years with an advertising expenditure of $400,000. O The confidence interval is wider than the prediction interval, because you use a different critical value when developing a prediction of the sales for one year with an advertising expenditure of $400,000 than when developing an estimate of the mean sales for all years with an advertising expenditure of $400,000. The confidence interval is wider than the prediction interval, because confidence intervals are used to predict values of y for new observations corresponding to given values of x, and prediction intervals give an estimate of the mean value of y for a given value of x. The prediction interval is wider than the confidence interval, because you use a different critical value when developing a prediction of the sales for one year with an advertising expenditure of $400,000 than when developing an estimate of the mean sales for all years with an advertising expenditure of $400,000. You may need to use the appropriate technology to answer this question. The following data represent a company's yearly sales and its advertising expenditure over a period of 8 years NOTE: Pay close attention to units as you answer the questions below. Sales (in $1,000,000s) (v) 15 16 18 16 19 19 24 Advertising Expenditure (in $1.000s) (x) 330 330 340 350 360 360 380 430 (a) Develop a scatter diagram of sales versus advertising and explain what it shows regarding the relationship between sales and advertising. The scatter diagram shows no apparent relationship between sales and advertising. O The scatter diagram shows a positive relationship between sales and advertising. The scatter diagram shows a negative relationship between sales and advertising. (b) Use the method of least squares to compute an estimated regression equation which uses advertising (x) to predict sales (y) P= (Round your numerical values to four decimal places) (c) What does the slope of the estimated regression line indicate? As the advertising expenditure goes up by $1,000, the sales are expected to by s (Give your answer in dollars, Round your answer to the nearest integer.) THE TOTES (d) Compute the coefficient of determination. (Round your answer to four decimal places) Fully interpret its meaning. (Give your answer as a percent. Round your answer to two decimal places) The value of the coefficient of determination tells us that (e) Compute the correlation coefficient. (Round your answer to four decimal places) (f) Use the F-test to determine whether or not the regression model is significant at a -0.05. State the null and alternative hypotheses. ⒸHO:₂0 H: 0 ⒸH₂:₂=0 H₂: ₂0 Ho: Po=0 H₂:0 ⒸHg² By zo H₂: A₁ <0 ⒸHOO Halo-o Find the value of the test statistic. (Round your answer to two decimal places) Find the p-value. p-value= (Round your answer to three decimal places) What is your conclusion? Do not reject Ho We can conclude that the model is significant. O Reject Ho. We can conclude that the model is significant. Beach Club Garde Autumn Communi % of the variability in 7 has been explained by the least squares line. Check out 2022 5 DU TRUL TEJELLTO E LOIT CUIUue unas une nouer is anymian O Reject Ho. We can conclude that the model is significant. Do not reject Ho. We cannot conclude that the model is significant. O Reject Ho. We cannot conclude that the model is significant. (9) Use the f-test to determine whether the slope of the regression model is significant at a = 0.05. State the null and alternative hypotheses. Hoi A₁ 20 H₂: A₁ <0 Ho: P₁0 H₂:₁0 Ho: Po=0 H₂: Do 0 Ho: ₁0 Ho: P₁0 O Ho: Po * 0 H₂: Po=0 Find the value of the test statistic. (Round your answer to three decimal places.) Find the p-value. p-value= (Round your answer to four decimal places.) What is your conclusion? O Reject Ho. We cannot conclude that the slope is significantly different from zero. O Reject Ho. We can conclude that the slope is significantly different from zero. Do not reject Ho. We can conclude that the slope is significantly different from zero. O Do not reject Ho. We cannot conclude that the slope is significantly different from zero. (h) If the company's advertising expenditure is $400,000, what are the predicted sales? Give the answer in dollars. (Round your answer to the nearest integer.) $ (h) If the company's advertising expenditure is $400,000, what are the predicted sales? Give the answer in dollars. (Round your answer to the nearest integer.) (1) Develop a 95% confidence interval for predicting the average sales for the years when $400,000 was spent on advertising. Give your answers in dollars. (Round your answers to the nearest integer.) to $ (1) Develop a 95% prediction interval for predicting the sales for a specific year when $400,000 was spent on advertising. Give your answers in dollars. (Round your answers to the nearest integer.) to $ (K) Discuss the differences in your answers to parts (1) and (3) O The prediction interval is wider than the confidence interval, because there is more variability associated with predicting the sales for one year with an advertising expenditure of $400,000 than there is with estimating the mean sales for all years with an advertising expenditure of $400,000 The confidence interval is wider than the prediction interval, because there is less variability associated with predicting the sales for one year with an advertising expenditure of $400,000 than there is with estimating the mean sales for all years with an advertising expenditure of $400,000. O The confidence interval is wider than the prediction interval, because you use a different critical value when developing a prediction of the sales for one year with an advertising expenditure of $400,000 than when developing an estimate of the mean sales for all years with an advertising expenditure of $400,000. The confidence interval is wider than the prediction interval, because confidence intervals are used to predict values of y for new observations corresponding to given values of x, and prediction intervals give an estimate of the mean value of y for a given value of x. The prediction interval is wider than the confidence interval, because you use a different critical value when developing a prediction of the sales for one year with an advertising expenditure of $400,000 than when developing an estimate of the mean sales for all years with an advertising expenditure of $400,000.
Expert Answer:
Answer rating: 100% (QA)
To analyze the given data set representing a companys yearly sales and advertising expenditure we will perform the following calculations and statisti... View the full answer

Related Book For 
Posted Date:
Students also viewed these mathematics questions
-
You may need to use the appropriate appendix table or technology to answer this question. A report states that adults 18- to 24- years-old send and recelve 128 texts every day. Suppose we take a...
-
You may need to use the appropriate appendix table or technology to answer this question. The increasing annual cost (including tuition, room, board, books, and fees) to attend college has been...
-
Explain why the auditors may need to use the work of a specialist in the audit of goodwill.
-
Question 1 Not yet answered Paints out of 1.00 P Flag question Question 2 Not yet answered Paints out of 1.00 P Flag question A project has the following activities, with specified precedents and...
-
Price changes of shares of Ralph Inc. have been recorded over the past 100 days. The frequency distribution is as follows: Price Change Probability - 1/2 .......0.06 - 3/8 .......0.08 - 1/4...
-
Data from an Izod impact test was described in Exercise 8-30. The sample standard deviation was 0.25 and n = 20 specimens were tested. (a) Test the hypothesis that = 0.10 against an alternative...
-
Hamilton Furniture doesnt expect prices to change dramatically and wants to use a method that averages price changes. Which inventory method would best meet Hamilton Furnitures goal? What if Hamilton...
-
Assume the following data for Lusk Inc. before its year-end adjustments: Journalize the adjusting entries for the following: a. Estimated customer allowances b. Estimated customer returns? Unadjusted...
-
- Job 652 was recently completed. Manufacturing overhead is allocated based on direct labor hours (DLH). The following data have been recorded on its job cost sheet: Direct materials Actual $59,400...
-
Arrow Hospitality prepares adjustments monthly and showed the following at September 30, 2023: Additional information available for the month ended September 30, 2023: a. Interest of $162 had accrued...
-
27.2.3 The complement system a. consists of 20 blood proteins. b. is triggered by bacterial cell walls. c. coats invading bacteria with proteins. d. All of the above.
-
A crate of mass 20.1 kg is sliding across a rough, horizontal floor at a speed of 4.02 m/s. At a time of 5.04 s, the frictional force stops the crate. What is the rate in watts at which the...
-
1. How does the reporting structure based upon organizational chart of a city or small club differ from that of a large hotel? Explain your answer. 2. EXPLAIN THE EIGHT KEY ELEMENTS OF TQM: ETHICS...
-
The salespeople at Culver, a notebook manufacturer, commonly pressured operations managers to keep costs down so the company could give bigger discounts to large customers. David, the operations...
-
What does a warranty specify to the buyer of a product or service?
-
A child's ball ( a thin hollow uniform sphere ) of mass 31 . 9 g and radius 0 . 38 4 m starts from rest and rolls without slipping down an inclined plane of vertical height 4 . 7 1 m . What is the...
-
Investors risk profile is composed of which components I ) Risk tolerance II ) Risk capacity III ) Relative returns IV ) Absolute returns
-
On average there are four traffic accidents in a city during one hour of rush-hour traffic. Use the Poisson distribution to calculate the probability that in one such hour there arc (a) No accidents...
-
Explain why, whereas it is not usually possible to measure a value for the active coupling constant responsible for a cross peak, it is sometimes possible to measure values of the passive coupling...
-
(a) Using EXCEL (or some other suitable program) set up a spreadsheet which computes the line frequencies and inten¬sities of both the AB and X parts of an ABX system for an arbitrary set of...
-
If there are two peaks in the spectrum, we can work out the effect of a pulse sequence by treating the two lines separately. There is a separate magnetization vector for each line. Suppose that a...
-
The mean free path \(\lambda\) of a molecule of gas is the average distance it travels before collision with another molecule. It is given by \[\lambda=C \frac{m}{ho d^{2}}\] where \(m\) and \(d\)...
-
A rectangular gate (width \(w=2 \mathrm{~m}\) ) is hinged as shown, with a stop on the lower edge. At what depth \(H\) will the gate tip? Water H 0.55 m 0.45 m P3.46 Hinge Stop
-
Gates in the Poe Lock at Sault Ste. Marie, Michigan, close a channel \(W=34 \mathrm{~m}\) wide, \(L=360 \mathrm{~m}\) long, and \(D=10 \mathrm{~m}\) deep. The geometry of one pair of gates is shown;...

Study smarter with the SolutionInn App