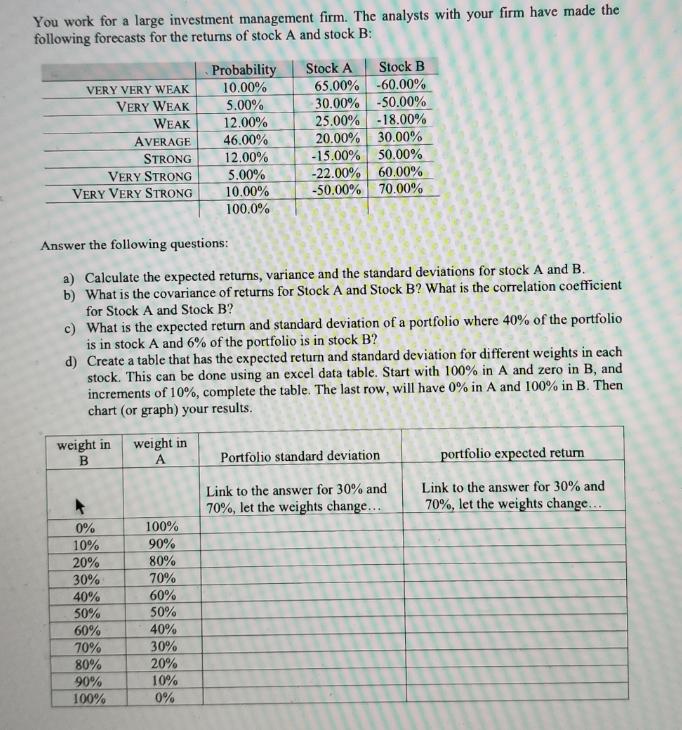
You work for a large investment management firm. The analysts with your firm have made the...
Fantastic news! We've Found the answer you've been seeking!
Question:
Transcribed Image Text:
You work for a large investment management firm. The analysts with your firm have made the following forecasts for the returns of stock A and stock B: VERY VERY WEAK VERY WEAK WEAK AVERAGE STRONG VERY STRONG VERY VERY STRONG weight in B 0% 10% 20% 30% 40% 50% 60% 70% 80% 90% 100% Answer the following questions: a) Calculate the expected returns, variance and the standard deviations for stock A and B. b) What is the covariance of returns for Stock A and Stock B? What is the correlation coefficient for Stock A and Stock B? weight in A Probability 10.00% 5.00% c) What is the expected return and standard deviation of a portfolio where 40% of the portfolio is in stock A and 6% of the portfolio is in stock B? d) Create a table that has the expected return and standard deviation for different weights in each stock. This can be done using an excel data table. Start with 100% in A and zero in B, and increments of 10%, complete the table. The last row, will have 0% in A and 100% in B. Then chart (or graph) your results. 100% 90% 80% 70% 60% 50% 40% 12.00% 46.00% 12.00% 30% 20% 10% 0% 5.00% 10.00% 100.0% Stock B 65.00% -60.00% 30.00% -50.00% 25.00% -18.00% 20.00% 30.00% -15.00% 50.00% -22.00% 60.00% -50.00% 70.00% Stock A Portfolio standard deviation Link to the answer for 30% and 70%, let the weights change... portfolio expected return Link to the answer for 30% and 70%, let the weights change... You work for a large investment management firm. The analysts with your firm have made the following forecasts for the returns of stock A and stock B: VERY VERY WEAK VERY WEAK WEAK AVERAGE STRONG VERY STRONG VERY VERY STRONG weight in B 0% 10% 20% 30% 40% 50% 60% 70% 80% 90% 100% Answer the following questions: a) Calculate the expected returns, variance and the standard deviations for stock A and B. b) What is the covariance of returns for Stock A and Stock B? What is the correlation coefficient for Stock A and Stock B? weight in A Probability 10.00% 5.00% c) What is the expected return and standard deviation of a portfolio where 40% of the portfolio is in stock A and 6% of the portfolio is in stock B? d) Create a table that has the expected return and standard deviation for different weights in each stock. This can be done using an excel data table. Start with 100% in A and zero in B, and increments of 10%, complete the table. The last row, will have 0% in A and 100% in B. Then chart (or graph) your results. 100% 90% 80% 70% 60% 50% 40% 12.00% 46.00% 12.00% 30% 20% 10% 0% 5.00% 10.00% 100.0% Stock B 65.00% -60.00% 30.00% -50.00% 25.00% -18.00% 20.00% 30.00% -15.00% 50.00% -22.00% 60.00% -50.00% 70.00% Stock A Portfolio standard deviation Link to the answer for 30% and 70%, let the weights change... portfolio expected return Link to the answer for 30% and 70%, let the weights change...
Expert Answer:
Answer rating: 100% (QA)
a Stock A expected return 0165 00530 01225 04620 01215 00522 0150 129 Variance of ... View the full answer
Related Book For
Business Statistics
ISBN: 9780321925831
3rd Edition
Authors: Norean Sharpe, Richard Veaux, Paul Velleman
Posted Date:
Students also viewed these finance questions
-
The mass spectra of 1-methoxybutane, 2-methoxybutane, and 2-methoxy-2-methylpropane are shown in Figure 13.7. Match the compounds with the spectra. 100 73 80 S 60 57 20 0 10 20 30 40 50 60 70 80 90...
-
The following spectra for A and B correspond to two structural isomers. The NMR singlet at (1.16 in spectrum A disappears when the sample is shaken with D2O.The singlet at (0.6 ppm in the spectrum of...
-
The National Weather Service has exacting definitions for hurricanes; they are tropical storms with winds in excess of 74 mph. The following bar graph shows the number of hurricanes, by month, that...
-
7. Given : (i) Losses follow exponential distribution with mean 1000. (ii) There is a deductible of 500. each (i) 10 losses are expected to exceed the deductible / year. A. Determine the amount to...
-
Nonverbal Communication Around the World Gestures play an important role when people communicate. Because culture shapes the meaning of gestures, miscommunication and misunderstanding can easily...
-
Calculate the energy output in each of the fusion reactions in the proton-proton cycle, and verify the values given in the above summary. Summary:
-
Using an elementary mechanics of materials approach, find the micromechanics equation for predicting the minor Poisson's ratio, \(v_{21}\), for a unidirectional fiber composite in terms of the...
-
Alquist Company uses the retail method to estimate its ending inventory . Selected information about its year 2011 operations is as follows: a. January 1, 2011, beginning inventory had a cost of...
-
Nike had sales of $44.487 billion in 2021. Suppose you expected its sales to grow at a rate of 18% in 2022, but then slow by 3% per year to the long-run growth rate that is characeristic of the...
-
Belltown Athletic Supply (BAS) makes game jerseys for athletic teams. The F. C. Kitsap soccer club has offered to buy 100 jerseys for the teams in its league for $15 per jersey. The team price for...
-
Expected future prices of components of a product to be assembled is an example of which element?
-
What is one disadvantage of Activity Based Costing? Explain in details.
-
=== 1. Let A = {1,2,3} and B = {4,5,6). Give an example of a relation R from A to B such that 1 is related to 5 but 2 is not related to 4.
-
How did the Soviets influence the political situation in Poland at the end of World War II?
-
The total liabilities of Hogan's Company on the balance sheet are $270,000; this amount is equal to three-fourths of the total assets. What is the amount of owners' equity?
-
What is one disadvantage of using a plant wide rate to allocate overhead? Explain in details.
-
Danielle, Arthur, and Carlos are responsible for bringing marshmallows to a party. Danielle has 1(3)/(4) bags, Arthur has 4(2)/(3), and Carlos has 3(1)/(2). How many total bags of marshmallows do...
-
Write a paper by answer the following question: Should Recycling Be Mandatory?
-
Suppose the state in Exercise 35 sampled 16 small retailers instead of 51, and for the sample of 16, the sample mean increase again equaled $ 2350 in additional sales tax revenue collected per...
-
The same graphite manufacturer from Exercise 21 uses an alternative process to make rolls. For this process the data are separated into 10 lanesa sample consists of one roll from each lane. The...
-
The gross domestic product (GDP) is an important measure of the overall economic strength of a country. GDP per capita makes comparisons between different size countries more meaningful. A researcher...
-
Compare the export rankings of the top ten leading exports of 1999 with the rankings of the top ten leading exports in 2010 (see Table 1.3). Discuss some of the reasons why these rankings have...
-
Use Table 1.1 to find the three most open economies in 2009, and the three most closed. How does the growth performance of these countries compare with the growth of the average country in the table?...
-
Use Table 1.1 to find three countries that have gone from being mostly closed to being open from 1980 to 2009. Also, find three countries where the reverse has happened. What has been the implication...
Study smarter with the SolutionInn App