

Chemical and mechanical engineers often need to know the vapor pressure of water at various temperatures (the
Question:
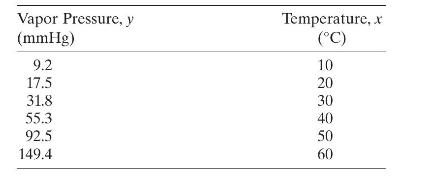
Chemical and mechanical engineers often need to know the vapor pressure of water at various temperatures (the "infamous" steam tables can be used for this). Below are data on the vapor pressure of water \((y)\) at various temperatures.
a. Fit a first-order model to the data. Overlay the fitted model on the scatterplot of \(y\) versus \(x\). Comment on the apparent fit of the model.
b. Prepare a scatterplot of predicted \(y\) versus the observed \(y\). What does this suggest about model fit?
c. Plot residuals versus the fitted or predicted \(y\). Comment on model adequacy.
d. Fit a second-order model to the data. Is there evidence that the quadratic term is statistically significant?
e. Repeat parts a-c using the second-order model. Is there evidence that the second-order model provides a better fit to the vapor pressure data?
Step by Step Answer:

This question has not been answered yet.
You can Ask your question!


Introduction To Linear Regression Analysis
ISBN: 9781119578727
6th Edition
Authors: Douglas C. Montgomery, Elizabeth A. Peck, G. Geoffrey Vining
