Question:
Consider the air pollution and mortality data given in Problem 3.15 and Table B. 15 .
Problem 3.15
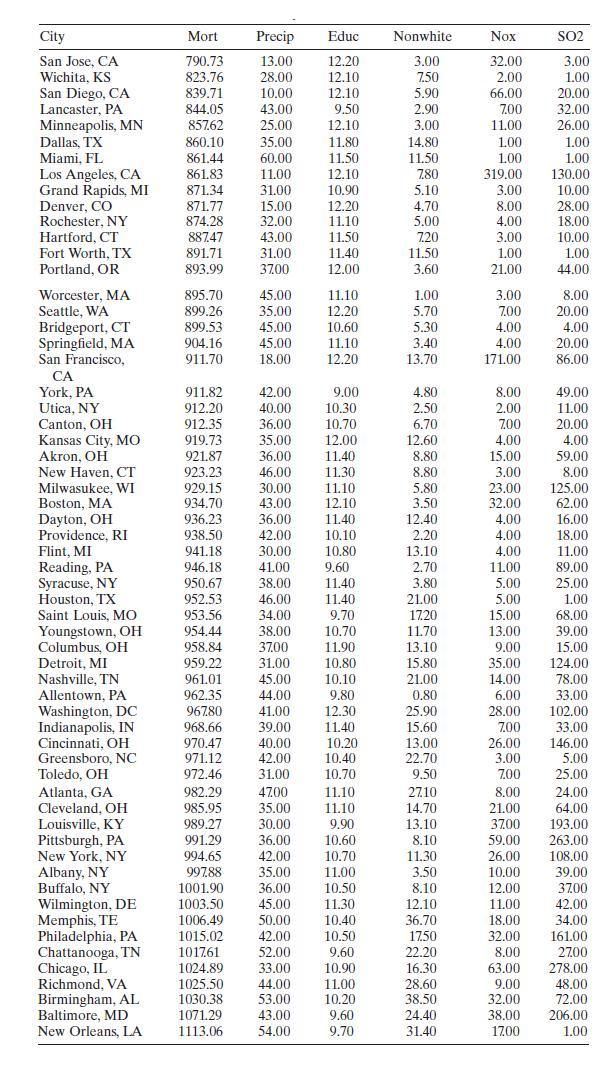
McDonald and Ayers [1978] present data from an early study that examined the possible link between air pollution and mortality. Table B. 15 summarizes the data. The response MORT is the total age-adjusted mortality from allcauses, in deaths per 100,000 population. The regressor PRECIP is the mean annual precipitation $\cdot$(in inches), EDUC is the median number of school years completed for persons of age 25 years or older, NONWHITE is the percentage of the 1960 population that is nonwhite, NOX is the relative pollution potential of oxides of nitrogen, and $\mathrm{SO}_{2}$ is the relative pollution potential of sulfur dioxide."Relative pollution potential" is the product of the tons emitted per day per square kilometer and a factor correcting the SMSA dimensions and exposure.
a. Construct a normal probability plot of the residuals from the full model. Does there seem to be any problem with the normality assumption?
b. Construct and interpret a plot of the residuals versus the predicted response.
Transcribed Image Text:
City Mort Precip Educ Nonwhite Nox SO2 San Jose, CA 790.73 13.00 12.20 3.00 32.00 3.00 Wichita, KS 823.76 28.00 12.10 7.50 2.00 1.00 San Diego, CA 839.71 10.00 12.10 5.90 66.00 20.00 Lancaster, PA 844.05 43.00 9.50 2.90 7.00 32.00 Minneapolis, MN 857.62 25.00 12.10 3.00 11.00 26.00 Dallas, TX 860.10 35.00 11.80 14.80 1.00 1.00 Miami, FL 861.44 60.00 11.50 11.50 1.00 1.00 Los Angeles, CA 861.83 11.00 12.10 7.80 319.00 130.00 Grand Rapids, MI 871.34 31.00 10.90 5.10 3.00 10.00 Denver, CO 871.77 15.00 12.20 4.70 8.00 28.00 Rochester, NY 874.28 32.00 11.10 5.00 4.00 18.00 Hartford, CT 887.47 43.00 11.50 7.20 3.00 10.00 Fort Worth, TX 891.71 31.00 11.40 11.50 1.00 1.00 Portland, OR 893.99 37.00 12.00 3.60 21.00 44.00 Worcester, MA 895.70 45.00 11.10 1.00 3.00 8.00 Seattle, WA 899.26 35.00 12.20 5.70 7.00 20.00 Bridgeport, CT 899.53 45.00 10.60 5.30 4.00 4.00 Springfield, MA 904.16 45.00 11.10 3.40 4.00 20.00 San Francisco, 911.70 18.00 12.20 13.70 171.00 86.00 CA York, PA 911.82 42.00 9.00 4.80 8.00 49.00 Utica, NY 912.20 40.00 10.30 2.50 2.00 11.00 Canton, OH 912.35 36.00 10.70 6.70 700 20.00 Kansas City, MO 919.73 35.00 12.00 12.60 4.00 4.00 Akron, OH 921.87 36.00 11.40 8.80 15.00 59.00 New Haven, CT 923.23 46.00 11.30 8.80 3.00 8.00 Milwaukee, WI 929.15 30.00 11.10 5.80 23.00 125.00 Boston, MA 934.70 43.00 12.10 3.50 32.00 62.00 Dayton, OH 936.23 36.00 11.40 12.40 4.00 16.00 Providence, RI 938.50 42.00 10.10 2.20 4.00 18.00 Flint, MI 941.18 30.00 10.80 13.10 4.00 11.00 Reading, PA 946.18 41.00 9.60 2.70 11.00 89.00 Syracuse, NY 950.67 38.00 11.40 3.80 5.00 25.00 Houston, TX 952.53 46.00 11.40 21.00 5.00 1.00 Saint Louis, MO 953.56 34.00 9.70 17.20 15.00 68.00 Youngstown, OH 954.44 38.00 10.70 11.70 13.00 39.00 Columbus, OH 958.84 37.00 11.90 13.10 9.00 15.00 Detroit, MI 959.22 31.00 10.80 15.80 35.00 124.00 Nashville, TN 961.01 45.00 10.10 21.00 14.00 78.00 Allentown, PA 962.35 44.00 9.80 0.80 6.00 33.00 Washington, DC 967.80 41.00 12.30 25.90 28.00 102.00 Indianapolis, IN 968.66 39.00 11.40 15.60 7.00 33.00 Cincinnati, OH 970.47 40.00 10.20 13.00 26.00 146.00 Greensboro, NC 971.12 42.00 10.40 22.70 3.00 5.00 Toledo, OH 972.46 31.00 10.70 9.50 700 25.00 Atlanta, GA 982.29 47.00 11.10 27.10 8.00 24.00 Cleveland, OH 985.95 35.00 11.10 14.70 21.00 64.00 Louisville, KY 989.27 30.00 9.90 13.10 37.00 193.00 Pittsburgh, PA 991.29 36.00 10.60 8.10 59.00 263.00 New York, NY 994.65 42.00 10.70 11.30 26.00 108.00 Albany, NY 997.88 35.00 11.00 3.50 10.00 39.00 Buffalo, NY 1001.90 36.00 10.50 8.10 12.00 37.00 Wilmington, DE 1003.50 45.00 11.30 12.10 11.00 42.00 Memphis, TE 1006.49 50.00 10.40 36.70 18.00 34.00 Philadelphia, PA 1015.02 42.00 10.50 1750 32.00 161.00 Chattanooga, TN 1017.61 52.00 9.60 22.20 8.00 2700 Chicago, IL 1024.89 33.00 10.90 16.30 63.00 278.00 Richmond, VA 1025.50 44.00 11.00 28.60 9.00 48.00 Birmingham, AL 1030.38 53.00 10.20 38.50 32.00 72.00 Baltimore, MD 1071.29 43.00 9.60 24.40 38.00 206.00 New Orleans, LA 1113.06 54.00 9.70 31.40 17.00 1.00


