Question:
Consider the multiple linear regression model for the rental price data in Problem 3.42.
Problem 3.42
Table B.24 contains data on median family home rental price and other data for 51 US cities. Fit a linear regression model using the median home rental price as the response variable and median price per square foot and population as the predictor variables.
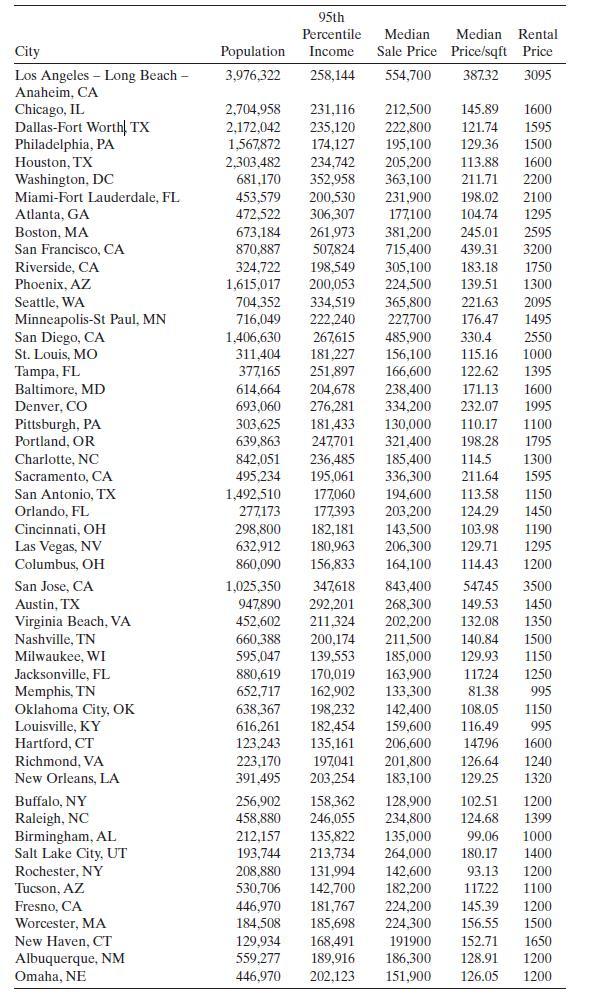
a. Find the value of the PRESS statistic and the $R^{2}$ based on PRESS for this model.
b. What conclusions can you draw about the ability of this model to accurately predict rental price?
Transcribed Image Text:
95th Percentile Median Median Rental City Population Income Sale Price Price/sqft Price Los Angeles Long Beach - 3,976,322 258,144 554,700 387.32 3095 Anaheim, CA Chicago, IL Dallas-Fort Worth, TX Philadelphia, PA 1,567,872 2,704,958 231,116 2,172,042 235,120 174,127 212,500 145.89 1600 Houston, TX 2,303,482 234,742 Washington, DC 681,170 352,958 363,100 211.71 222,800 195,100 129.36 1500 205,200 113.88 1600 2200 121.74 1595 Miami-Fort Lauderdale, FL 453,579 200,530 231,900 198.02 2100 Atlanta, GA 472,522 306,307 177,100 104.74 1295 Boston, MA 673,184 261,973 381,200 245.01 2595 San Francisco, CA 870,887 507,824 715,400 439.31 3200 Riverside, CA 324,722 198,549 305,100 183.18 1750 Phoenix, AZ 1,615,017 200,053 224,500 139.51 1300 Seattle, WA 704,352 334,519 365,800 221.63 2095 Minneapolis-St Paul, MN 716,049 222,240 227,700 176.47 1495 San Diego, CA 1,406,630 267,615 485,900 330.4 2550 St. Louis, MO 311,404 181,227 156,100 115.16 1000 Tampa, FL 377,165 251,897 166,600 122.62 1395 Baltimore, MD 614,664 204,678 238,400 171.13 1600 Denver, CO 693,060 276,281 334,200 232.07 1995 Pittsburgh, PA 303,625 181,433 130,000 110.17 1100 Portland, OR 639,863 247,701 321,400 198.28 1795 Charlotte, NC 842,051 236,485 185,400 114.5 1300 Sacramento, CA 495,234 195,061 336,300 211.64 1595 San Antonio, TX 1,492,510 177,060 194,600 113.58 1150 Orlando, FL 277,173 177,393 203,200 124.29 1450 Cincinnati, OH 298,800 182,181 Las Vegas, NV 632,912 180,963 Columbus, OH 860,090 156,833 San Jose, CA 1,025,350 347,618 143,500 103.98 1190 206,300 129.71 1295 164,100 114.43 1200 843,400 547.45 3500 Austin, TX 947,890 292,201 268,300 149.53 1450 Virginia Beach, VA 452,602 211,324 202,200 132.08 1350 Nashville, TN 660.388 200,174 211,500 140.84 1500 Milwaukee, WI 595,047 139,553 185,000 129.93 1150 Jacksonville, FL 880,619 170,019 163,900 117.24 1250 Memphis, TN 652,717 162,902 133,300 81.38 995 Oklahoma City, OK 638,367 198,232 142,400 108.05 1150 Louisville, KY 616,261 182,454 159,600 116.49 995 Hartford, CT 123,243 135,161 206,600 147.96 1600 Richmond, VA 223,170 197,041 New Orleans, LA 391,495 203,254 201,800 126.64 183,100 129.25 1320 1240 Buffalo, NY 256,902 158,362 Raleigh, NC 458,880 246,055 Birmingham, AL 212,157 135,822 128,900 102.51 1200 234,800 124.68 1399 135,000 99.06 1000 Salt Lake City, UT 193,744 213,734 264,000 180.17 1400 Rochester, NY 208,880 131,994 142,600 93.13 1200 Tucson, AZ 530,706 142,700 182,200 11722 1100 Fresno, CA 446,970 181,767 224,200 145.39 1200 Worcester, MA 184,508 185,698 224,300 156.55 1500 New Haven, CT Albuquerque, NM Omaha, NE 129,934 168,491 559,277 189,916 446,970 202,123 191900 186,300 128.91 1200 152.71 1650 151,900 126.05 1200


