

Consider the simple linear regression model fit to the tank pressure and volume data in Problem 2.16.
Question:
Consider the simple linear regression model fit to the tank pressure and volume data in Problem 2.16.
Problem 2.16
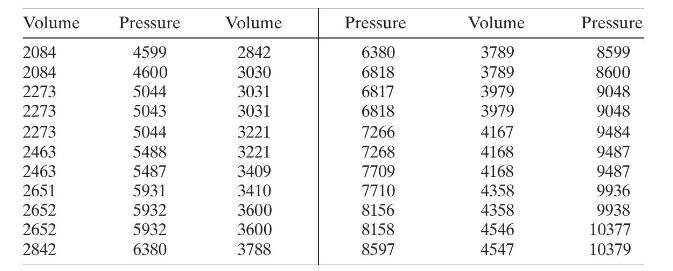
Carroll and Spiegelman ("The Effects of Ignoring Small Measurement Errors in Precision Instrument Calibration," Journal of Quality Technology, 18, 170$173,1986)$ look at the relationship between the pressure in a tank and the volume of liquid. The following table gives the data. Use an appropriate statistical software package to perform an analysis of these data. Comment on the output produced by the software routine.
a. Construct a normal probability plot of the residuals. Does there seem to be any problem with the normality assumption?
b. Construct and interpret a plot of the residuals versus the predicted response.
c. Suppose that the data were collected in the order shown in the table. Plot the residuals versus time order and comment on the plot.
Step by Step Answer:

This question has not been answered yet.
You can Ask your question!


Introduction To Linear Regression Analysis
ISBN: 9781119578727
6th Edition
Authors: Douglas C. Montgomery, Elizabeth A. Peck, G. Geoffrey Vining
