

Consider the simple regression model fit to the National Football League team performance data in Problem 2.1.
Question:
Consider the simple regression model fit to the National Football League team performance data in Problem 2.1.
Data From Problem 2.1
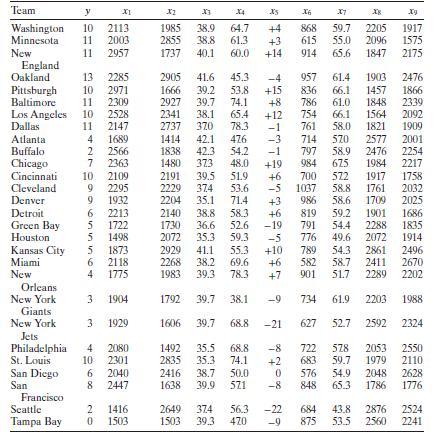
Table B. 1 gives data concerning the performance of the 26 National Football League teams in 1976. It is suspected that the number of yards gained rushing by opponents $\left(x_{8}\right)$ has an effect on the number of games won by a team $(y)$.
a. Construct a normal probability plot of the residuals. Does there seem to be any problem with the normality assumption?
b. Construct and interpret a plot of the residuals versus the predicted response.
c. Plot the residuals versus the team passing yardage, $x_{2}$. Does this plot indicate that the model will be improved by adding $x_{2}$ to the model?
Step by Step Answer:

This question has not been answered yet.
You can Ask your question!


Introduction To Linear Regression Analysis
ISBN: 9781119578727
6th Edition
Authors: Douglas C. Montgomery, Elizabeth A. Peck, G. Geoffrey Vining
