

Draw a graph depicting the three living locations in the previous problem. Previous problem As energy costs
Question:
Draw a graph depicting the three living locations in the previous problem.
Previous problem
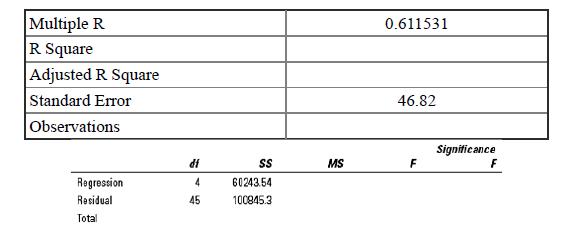
As energy costs skyrocket, customers of Burlington Power expressed concern over their home heating bills. The staff at Burlington selects a sample of n = 50 home owners to form a data set regressing monthly invoices for February on family size, square footage of the home, and if the home was located in the city, a suburban locale, or rural county area. Partial results are shown here.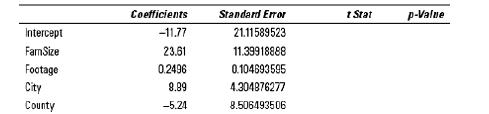
Step by Step Answer:

This question has not been answered yet.
You can Ask your question!
Related Book For 

Introductory Regression Analysis With Computer Application For Business And Economics
ISBN: 9780415899338
1st Edition
Authors: Allen Webster
Question Posted:
