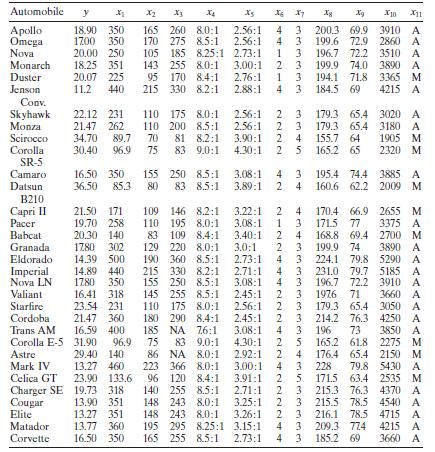
Table B. 3 presents data on the gasoline mileage performance of 32 different automobiles. a. Fit a
Question:
Table B. 3 presents data on the gasoline mileage performance of 32 different automobiles.
a. Fit a simple linear regression model relating gasoline mileage $y$ (miles per gallon) to engine displacement $x_{1}$ (cubic inches).
b. Construct the analysis-of-variance table and test for significance of regression.
c. What percent of the total variability in gasoline mileage is accounted for by the linear relationship with engine displacement?
d. Find a $95 % \mathrm{CI}$ on the mean gasoline mileage if the engine displacement is 275 in. $^{3}$
e. Suppose that we wish to predict the gasoline mileage obtained from a car with a 275 -in. ${ }^{3}$ engine. Give a point estimate of mileage. Find a $95 %$ prediction interval on the mileage.
f. Compare the two intervals obtained in parts $d$ and e. Explain the difference between them. Which one is wider, and why?
Transcribed Image Text:
Automobile X5 X6 X7 X X X1011 Apollo 18.90 350 165 260 8.0:1 2.56:1 4 3 Omega 1700 350 170 275 8.5:1 2.56:1 4 3 200.3 69.9 3910 A 199.6 72.9 2860 A Nova 20.00 250 105 185 8.25:1 2.73:1 1 3 196.7 72.2 3510 A Monarch 18.25 351 143 255 8.0:1 3.00:1 2 3 199.9 74.0 3890 A Duster 20.07 225 95 170 8.4:1 2.76:1 1 3 194.1 71.8 3365 M Jenson 11.2 440 215 330 8.2:1 2.88:1 4 3 184.5 69 4215 A Conv. Skyhawk 22.12 231 110 175 8.0:1 2.56:1 2 3 179.3 65.4 3020 A Monza 21.47 262 110 200 8.5:1 110 200 8.5:1 2.56:1 2 3 179.3 65.4 3180 A Scirocco 34.70 89.7 70 81 8.2:1 3.90:1 2 4 155.7 64 1905 M Corolla 30.40 96.9 75 83 9.0:1 4.30:1 2 5 165.2 65 2320 M SR-5 Camaro 16.50 350 155 250 8.5:1 3.08:1 4 3 195.4 74.4 3885 A Datsun 36.50 85.3 80 83 8.5:1 3.89:1 2 4 160.6 62.2 2009 M B210 Capri II 21.50 171 109 146 8.2:1 3.22:1 2 4 170.4 66.9 2655 M Pacer 19.70 258 110 195 8.0:1 3.08:1 1 3 171.5 77 3375 A Babcat 20.30 140 83 109 8.4:1 3.40:1 2 4 168.8 69.4 2700 M Granada 1780 302 129 220 8.0:1 3.0:1 2 3 199.9 74 3890 A Eldorado 14.39 500 Imperial Nova LN 14.89 440 1780 350 Valiant 16.41 318 190 360 8.5:1 215 330 8.2:1 155 250 8.5:1 145 255 8.5:1 2.73:1 4 3 224.1 79.8 5290 A 2.71:1 3.08:1 4 3 2.45:1 2 3 4 3 231.0 79.7 5185 A 196.7 72.2 3910 A 1976 71 3660 A Starfire 23.54 231 110 175 8.0:1 2.56:1 2 3 179.3 65.4 3050 A Cordoba 21.47 360 180 290 8.4:1 2.45:1 2 3 214.2 76.3 4250 A Trans AM 16.59 400 Corolla E-5 31.90 96.9 Astre 29.40 140 Mark IV 185 NA 7.6:1 75 83 9.0:1 86 NA 8.0:1 13.27 460 223 366 8.0:1 3.08:1 3.08:1 4 3 196 73 3850 A 4.30:1 25 165.2 61.8 2275 M 2.92:1 2 4 176.4 65.4 2150 M 3.00:1 4 3 228 79.8 5430 A Celica GT 23.90 133.6 96 120 8.4:1 Charger SE 19.73 318 Cougar 13.90 351 Elite 13.27 351 Matador 13.77 360 Corvette 16.50 350 140 255 8.5:1 148 243 8.0:1 148 243 8.0:1 195 295 8.25:1 165 255 8.5:1 3.91:1 2 5 2.71:1 2 3 3.25:1 2 3 3.26:1 2 3 3.15:1 4 3 2.73:1 4 3 171.5 63.4 2535 M 215.3 76.3 4370 A 215.5 78.5 4540 A 216.1 78.5 4715 A 209.3 774 4215 A 185.2 69 3660 A
Fantastic news! We've Found the answer you've been seeking!
Step by Step Answer:
Answer rating: 100% (QA)
Answered By
Saikumar Ramagiri
Financial accounting:- Journal and ledgers, preparation of trail balance and adjusted trail balance Preparation of income statement, retained earning statement and balance sheet Banks reconciliation statements Financial statement analysis Cash flow statement analysis (both direct and indirect methods) All methods of Depreciations Management Accounting:- Ratios Budgeting control Cash budget and production budget Working capital management Receivable management Costing:- Standard and variance costing Marginal costing and decision making Cost-volume-profit analysis Inventory management (LIFO, FIFO) Preparation and estimation of cost sheet Portfolio management:- Calculation of portfolio standard deviation or risk Calculation of portfolio expected returns CAPM, Beta Financial management:- Time value of money Capital budgeting Cost of capital Leverage analysis and capital structure policies Dividend policy Bond value calculations like YTM, current yield etc International finance:- Derivatives Futures and options Swaps and forwards Business problems Finance problems Education (mention all your degrees, year awarded, Institute/University, field(s) of major): Education Qualification Board/Institution/ University Month/Year of Passing % Secured OPTIONALS/ Major ICWAI(inter) ICWAI inter Pursuing Pursuing - M.com(Finance) Osmania University June 2007 65 Finance & Taxation M B A (Finance) Osmania University Dec 2004 66 Finance & Marketing. B.Com Osmania University June 2002 72 Income Tax, Cost & Mgt, Accountancy, Auditing. Intermediate (XII) Board of Intermediate May 1999 58 Mathematics, Accountancy, Economics. S S C (X) S S C Board. May 1997 74 Mathematics, Social Studies, Science. Tutoring experience: • 10 year experience in online trouble shooting problems related to finance/accountancy. • Since 6 Years working with solution inn as a tutor, I have solved thousands of questions, quick and accuracy Skills (optional): Technical Exposure: MS Office, SQL, Tally, Wings, Focus, Programming with C Financial : Portfolio/Financial Management, Ratio Analysis, Capital Budgeting Stock Valuation & Dividend Policy, Bond Valuations Individual Skills : Proactive Nature, Self Motivative, Clear thought process, Quick problem solving skills, flexible to complex situations. Achievements : 1. I have received an Award certificate from Local Area MLA for the cause of getting 100% marks in Accountancy during my Graduation. 2. I have received a GOLD MEDAL/Scholarship from Home Minister in my MBA for being the “Top Rank student “ of management institute. 3. I received numerous complements and extra pay from various students for trouble shooting their online problems. Other interests/Hobbies (optional): ? Web Surfing ? Sports ? Watching Comics, News channels ? Miniature Collection ? Exploring hidden facts ? Solving riddles and puzzles