

The data in the table below give the percentage share of market of a particular brand of
Question:
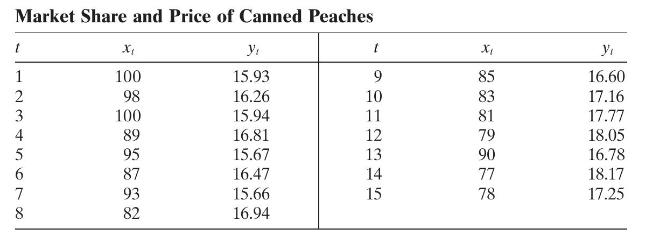
The data in the table below give the percentage share of market of a particular brand of canned peaches \(\left(y_{t}\right)\) for the past 15 months and the relative selling price \(\left(x_{t}\right)\).
a. Fit a simple linear regression model to these data. Plot the residuals versus time. Is there any indication of autocorrelation?
b. Use the Durbin-Watson test to determine if there is positive autocorrelation in the errors. What are your conclusions?
c. Use one iteration of the Cochrane-Orcutt procedure to estimate the regression coefficients. Find the standard errors of these regression coefficients.
d. Is there positive autocorrelation remaining after the first iteration? Would you conclude that the iterative parameter estimation technique has been successful?
Step by Step Answer:

This question has not been answered yet.
You can Ask your question!


Introduction To Linear Regression Analysis
ISBN: 9781119578727
6th Edition
Authors: Douglas C. Montgomery, Elizabeth A. Peck, G. Geoffrey Vining
