

The United States is the biggest consumer of natural gas, and the second largest natural gas producer
Question:
The United States is the biggest consumer of natural gas, and the second largest natural gas producer in the world. According to the U.S. Energy Information Administration (EIA), the United States consumed 26.7 trillion cubic feet of natural gas in 2014. Stemming from phased deregulation, the transportation and delivery of natural gas from wellheads has grown since the 1980s and there are now more than 278,000 miles of gas pipeline nationwide. With more electric power companies turning to natural gas as a cleaner-burning fuel, natural gas is expected to grow even more quickly over the next 20 years.
To ensure an adequate supply of natural gas, gas storage facilities have been built in numerous places along the pipeline. Energy companies can buy gas when prices are low and store it in these facilities for use or sale at a later date. Because energy consumption is influenced greatly by the weather (which is not entirely predictable), imbalances often arise in the supply and demand for gas in different parts of the country. Gas traders constantly monitor these market conditions and look for opportunities to sell gas from storage facilities when the price offered at a certain location is high enough. This decision is complicated by the fact that it costs different amounts of money to transport gas through different segments of the nationwide pipeline, and the capacity available in different parts of the pipeline is constantly changing. Thus, when a trader sees an opportunity to sell at a favorable price, he or she must quickly see how much capacity is available in the network and create deals with individual pipeline operators for the necessary capacity to move gas from storage to the buyer.
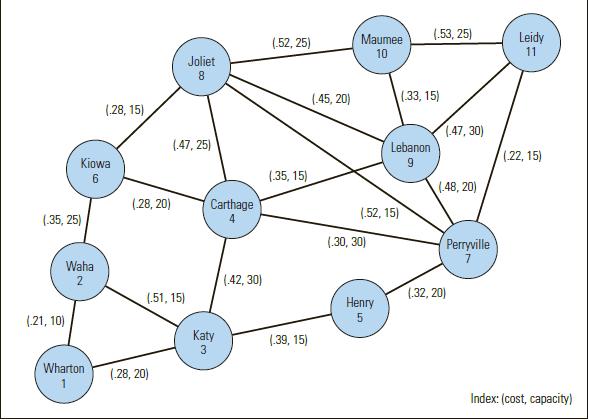
Bruce McDaniel is a gas trader for Old Dominion Energy (ODE), Inc. The network in Figure 5.45 represents a portion of the gas pipeline where ODE does business. The values next to each arc in this network are of the form (x,y) where x is the cost per thousand cubic feet (cf) of transporting gas along the arc, and y is the available transmission capacity of the arc in thousands of cubic feet. Note that the arcs in this network are bidirectional (i.e., gas can flow in either direction at the prices and capacities listed).
Bruce currently has 100,000 cf of gas in storage at Katy. Industrial customers in Joliet are offering $4.35 per thousand cf for up to 35,000 cf of gas. Buyers in Leidy are offering $4.63 per thousand cf for up to 60,000 cf of gas. Create a spreadsheet model to help Bruce answer the following questions.
a. Given the available capacity in the network, how much gas can be shipped from Katy to Leidy? From Katy to Joliet?
b. How much gas should Bruce offer to sell to Joliet and Leidy if he wants to maximize profits?
c. Is Bruce able to meet all the demand from both customers? If not, why not?
d. If Bruce wanted to try to pay more to obtain additional capacity on some of the pipelines, which ones should he investigate and why?
FIGURE 5.46:
Step by Step Answer:
Given the information and the network in the provided image we can start addressing Bruces questions using the data for costs and capacities along the different arcs of the pipeline network Since we c...View the full answer


Spreadsheet Modeling And Decision Analysis A Practical Introduction To Business Analytics
ISBN: 9781305947412
8th Edition
Authors: Cliff T. Ragsdale
