Obtain the daily closes of the S&P 500 from January 1, 1990, through December 31, 2017, and
Question:
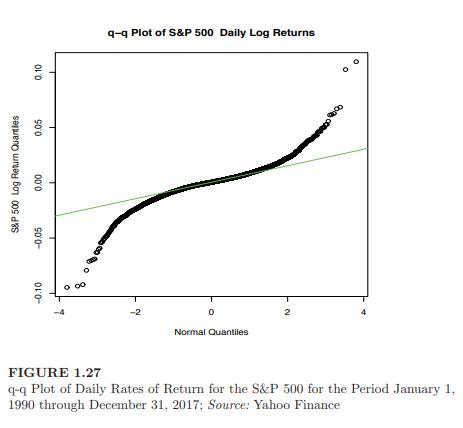
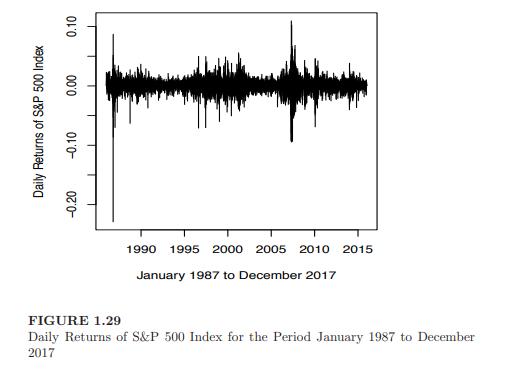
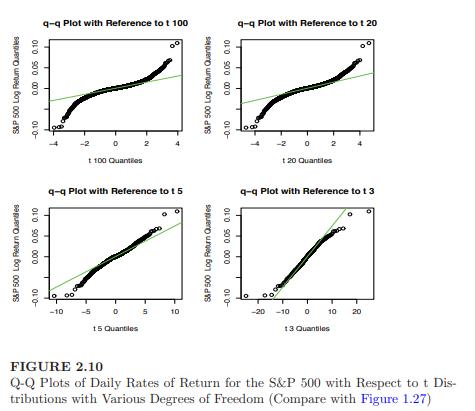
Obtain the daily closes of the S\&P 500 from January 1, 1990, through December 31, 2017, and compute the daily log returns. These are the data used in Figure 1.27 on page 92 and a subset of those shown in Figure 1.29 on page 99. Q-q plots of the data are shown in Figure 1.27 and Figure 2.10.
(a) Compute the historical volatility of the daily returns.
Produce a new set of "returns" by multiplying each of the observed returns by 10. Compute the historical volatility of these "returns".
Now produce two q-q plots of these two datasets with respect to a normal distribution, side by side.
Do you see any differences? Comment.
(b) Divide the S\&P 500 daily log returns into four periods, January 1, 1992, through December 31, 1995;
January 1, 1997, through December 31, 2002;
January 1, 2003, through December 31, 2005;
January 1, 2006, through December 31, 2009.
Compute the historical volatility for each period. (See the plot in Figure 1.29 on page 99.)
Now, produce a two-by-two display of q-q plots with respect to a normal distribution for the returns in these four periods.
Comment on your results.
Step by Step Answer:

This question has not been answered yet.
You can Ask your question!