Obtain the daily closes of the S&P 500 from January 1, 1990, through December 31, 2017, and
Question:
Obtain the daily closes of the S\&P 500 from January 1, 1990, through December 31, 2017, and compute the daily log returns. These are the data used in Figure 4.6.
Divide the S\&P 500 daily log returns into four periods, January 1, 1992, through December 31, 1995;
January 1, 1997, through December 31, 2002;
January 1, 2003, through December 31, 2005;
January 1, 2006, through December 31, 2009.
In each of these periods, the volatility was relatively constant, but it differed markedly between the periods.
For the data in each period, produce a Hill plot for the lower tail. These plots will show the types of variation that we often see in Hill plots. You may use the hill function in the evir R package, or any other function to compute the Hill estimator, or you may just write code to compute the estimates. (The algorithm is just a simple direct coding of the definition.)
Identify an interval of stability in each plot. (This is rather subjective.) Compute an estimate of the lower tail index for the distribution in each period as the mean of Hill's estimate over the interval of stability.
How do the estimates of the tail index differ? How do the estimates compare to the tail index of a t distribution?
Do you see any relation to the differing levels of volatility over those different periods?
Figure 4.6: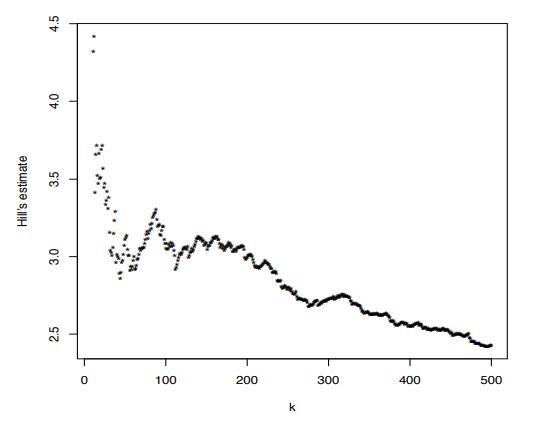
Step by Step Answer:

This question has not been answered yet.
You can Ask your question!