

The following table lists the numbers of persons killed in fatal car crashes for three different categories
Question:
The following table lists the numbers of persons killed in fatal car crashes for three different categories of blood alcohol content (BAC) of drivers. (The data are from the U.S. Census Bureau.)
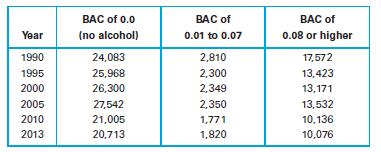
Creating Graphics. Exercises give tables of real data. For each table, construct a graphical display of the data. Choose any graphic type that you feel is appropriate to the data set. In addition to constructing the graph, explain why you chose this type of display and describe interesting patterns in the data.
Step by Step Answer:

This question has not been answered yet.
You can Ask your question!
Related Book For 

Statistical Reasoning For Everyday Life
ISBN: 978-0134494043
5th Edition
Authors: Jeff Bennett, William Briggs, Mario Triola
Question Posted:
