

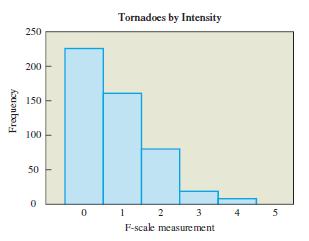
The histogram in Figure 4.9 shows the F-scale measurements of intensities of 490 tornadoes from recent years.
Question:
The histogram in Figure 4.9 shows the F-scale measurements of intensities of 490 tornadoes from recent years. (The F-scale runs from 0 to 5; a higher number indicates a stronger tornado.)
Does It Make Sense? For Exercises, determine whether the statement makes sense (or is clearly true) or does not make sense (or is clearly false). Explain clearly; not all of these statements have definitive answers, so your explanation is more important than your chosen answer.
Fantastic news! We've Found the answer you've been seeking!
Step by Step Answer:
The histogram ...View the full answer

Answered By
Marvine Ekina
Marvine Ekina
Dedicated and experienced Academic Tutor with a proven track record for helping students to improve their academic performance. Adept at evaluating students and creating learning plans based on their strengths and weaknesses. Bringing forth a devotion to education and helping others to achieve their academic and life goals.
PERSONAL INFORMATION
Address: , ,
Nationality:
Driving License:
Hobbies: reading
SKILLS
????? Problem Solving Skills
????? Predictive Modeling
????? Customer Service Skills
????? Creative Problem Solving Skills
????? Strong Analytical Skills
????? Project Management Skills
????? Multitasking Skills
????? Leadership Skills
????? Curriculum Development
????? Excellent Communication Skills
????? SAT Prep
????? Knowledge of Educational Philosophies
????? Informal and Formal Assessments
0 Reviews
10+ Question Solved
Related Book For 

Statistical Reasoning For Everyday Life
ISBN: 978-0134494043
5th Edition
Authors: Jeff Bennett, William Briggs, Mario Triola
Question Posted:
