

The stack plot in Figure 3.25 shows the numbers of bachelors degrees awarded to males and females
Question:
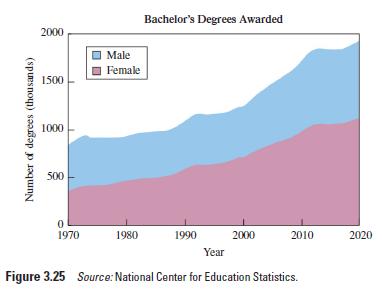
The stack plot in Figure 3.25 shows the numbers of bachelor’s degrees awarded to males and females since 1970. The last few years are projections.
a. Estimate the numbers of bachelor’s degrees to be awarded to males and to females (separately) in 2020.
b. About when were the numbers of bachelor’s degrees equal for males and females?
c. Comment on the overall trend.
d. Do you think the stack plot is an effective way to display these data? Briefly discuss other graphics that might have been used instead.
Fantastic news! We've Found the answer you've been seeking!
Step by Step Answer:
n mle bthelr hlders 1950000 N f femle bthelr hlders 1050000 b they never be equl there is n inresi...View the full answer

Answered By
Antony Mutonga
I am a professional educator and writer with exceptional skills in assisting bloggers and other specializations that necessitate a fantastic writer. One of the most significant parts of being the best is that I have provided excellent service to a large number of clients. With my exceptional abilities, I have amassed a large number of references, allowing me to continue working as a respected and admired writer. As a skilled content writer, I am also a reputable IT writer with the necessary talents to turn papers into exceptional results.
2+ Reviews
10+ Question Solved
Related Book For 

Statistical Reasoning For Everyday Life
ISBN: 978-0134494043
5th Edition
Authors: Jeff Bennett, William Briggs, Mario Triola
Question Posted:
