

The following are four distributions that have different shapes, but the same values and scales on the
Question:
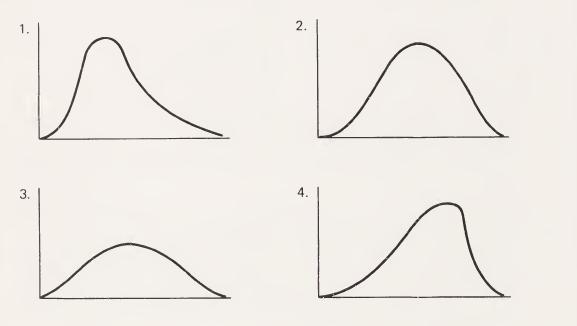
The following are four distributions that have different shapes, but the same values and scales on the horizontal axis:
Required :
a. Assuming the distributions represent populations of data, explain how the sampling distribution for each population could have been determined.
b. Assuming the distributions are sampling distributions derived using difference estimation, which ones are likely to indicate difference estimation to be a reliable estimator? Explain your answer.
c. Continuing from part b, for which of the four distributions shown is difference estimation likely to be the least efficient estimator? Explain your answer.
d. Assuming again, as in part a, that the distributions represent population data, for which of the populations, where one sample is taken from the population, would there be a greater likelihood than the nominal probability of the population’s being accepted as fairly stated, assuming that each of the populations is misstated by an amount slightly greater than the amount the auditor considers material ? Explain your answer.
e. Explain how the auditor can determine whether difference estimation is a reliable estimator in a particular situation.
Step by Step Answer:


Applications Of Statistical Sampling To Auditing
ISBN: 9780130391568
1st Edition
Authors: Alvin A. Arens, James K. Loebbecke
