

Consider the US monthly macroeconomic data used in Example 8.4. Use the same training and testing subsamples,
Question:
Consider the US monthly macroeconomic data used in Example 8.4. Use the same training and testing subsamples, and apply a DL network below
```
mod mod %>%\
layer_dense(units=32,activation="relu",input_shape=c(k)) %>%\
layer_dropout(rate=0.4) %>%\
layer_dense(units=16,activation="relu") %>%\
layer_dropout(rate=0.25) %>%\
layer_dense(units=16,activation="relu") %>%\
layer_dropout(rate=0.25) %>%\
layer_dense(units=4,activation="relu") %>%\
layer_dense(units=1)\
```
What are the root mean squared error, mean absolute error, and median absolute error in the testing subsample? Compare the results with those in Example 8.4.
Example 8.4:
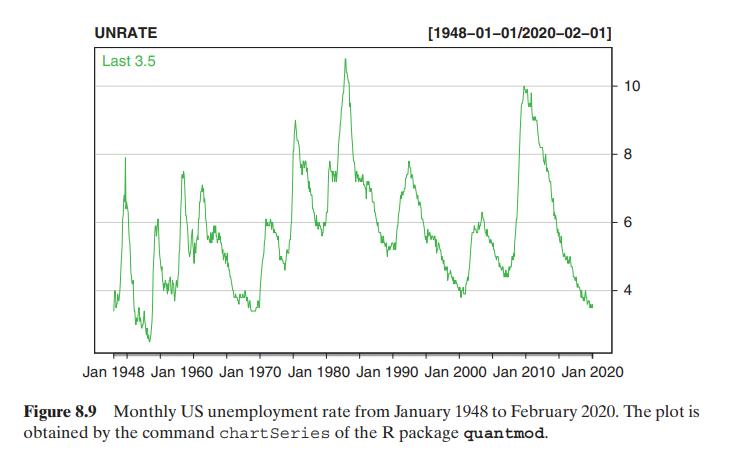
In this example, we consider US monthly unemployment rate from January 1948 to February 2020. The data are seasonally adjustment and can be downloaded directly from the FRED, which is the Economic Database of the Federal Reserve Banks at St. Louis. In fact, one can download the data over the Internet via the R package quantmod. Details are given in the attached R commands and output. Alternatively, the data are also in the file unrate4820.txt. Figure 8.9 shows the time plot of the US monthly unemployment rate data.
Step by Step Answer:

This question has not been answered yet.
You can Ask your question!


Statistical Learning For Big Dependent Data
ISBN: 9781119417385
1st Edition
Authors: Daniel Peña, Ruey S. Tsay
