Question:
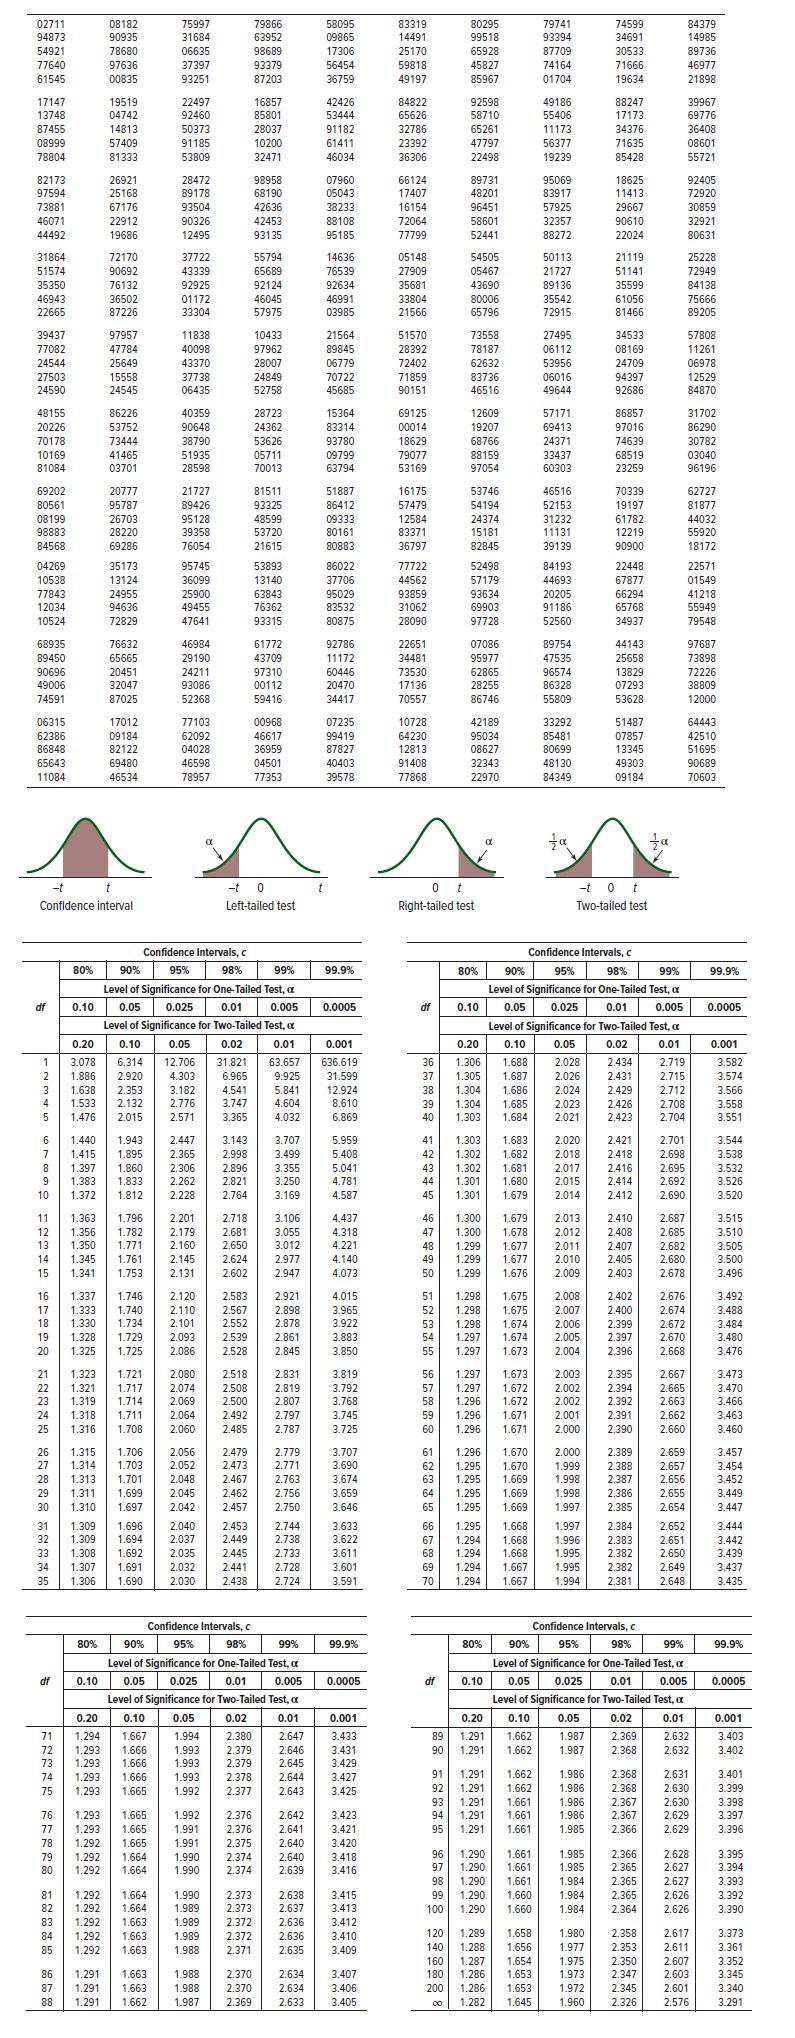
In parts a, b, and c, use the t-distribution in Appendix B.5 to determine the margin of error in estimating the population mean with a 95% confidence interval if:a. s = 10 and n = 10.b. s = 10 and n = 20.c. s = 10 and n = 30.
d. As sample size increases, how does the margin of error change? What would bethe effect on a confidence interval as sample size increases?
Transcribed Image Text:
02711
94873
54921
61545
17147
13746
00000
78804
PAGA
46071
44492
51574
35350
46943
22665
77082
24544
24590
48155
20226
70178
10169
69202
80561
08199
98883
84568
04269
10538
17843
10524
68935
00206
49006
74591
06215
63306
06940
65642
11081
df 0.10
12345
12345
NANG 2N228
df
172 73 74 75 75 7 78 7 80
1 300
1.308
08182
90935
Foogk
00835
19519
04/42
57400
81333
1 202
1.293
26921
67176
Confidence interval
19686
72170
90692
76132
36502
87226
97957
47784
1.292
25649
15558
24545
86226
53752
1.201
1.292
73444
41465
03701
1.29
1.291
20777
95787
26703
28220
69286
35173
13124
24955
72829
76632
09009
22047
87025
00404
82122
69480
46534
1701
75997
31684
06635
02251
1293 1.665
22497
92460
01105
53809
1.293 1.665
1.293 1.665
1.665
28412
BARA
00226
12495
10000
03025
MASA
Confidence Intervals, c
80% 90% 95% 9
22201
11838
40098
43370
37738
06435
0.20 0.10 0.05
3.078 6.314
1.886 2.920
1.638 2.353
1.533 2.132
1.476 2.015
ACCA
1.292 1.664
1.29
1:009
40359
90648
38790
20
51935
2859:
21727
89426
95128
39358
76054
1.415
1.89!
1.397 1.860 2.306
1.833 2.262
2.228
95745
36099
40455
47641
46984
29190
296
52368
77103
63003
04028
16500
70057
80% 90% 95%
0.10 0.05 0.025
2.447
2.365
2 201
2,037
2.035
Level of Significance for One-Tailed Test, a
0.05 0.025
Level of Significance for Two-Tailed Test, a
992
1.991
1.991
10000
3.143
2.998
1.990
1.989
2.896
2.821
2.764
2.681
2.650
0.20
1294 1.667
1.666 1.993 2 2.379
1:293 1.666 1.993
1.993
26580
Confidence Intervals.
0.02 0.01
12.706 1.821 63 657
4.303 6.965 9.925
3.182
2.776
4.541 5.841
3747 4.604
2.571
3.365 4.032
2.479
6103
2457
2 449
2445
-t 0
Left-tailed test
79866
63952
20000
87203
1685
09001
40006
22471
96950
42626
42452
93135
2.376
2.376
2.375
5570/
65689
92124
A6045
57975
2:00
77
N
10433
97962
28007
24840
52758
2872
24362
53626
05711
70013
53893
13140
200
93315
2.313
81511
93325
48599
mm
A
53720
21615
Level of Significance for One-Tailed Test, a
2.370
988
1.988 2.370
01712
carve
00117
59410
00965
25050
4501
77353
98% 99% 99.9%
0.01 0.005 0.0005
3.707
3.499
3.355
3.250
3.169
3.106
3.055
N
N
2.763
58095
09865
17300
36759
J
42426
53444
N
46034
2.638
2.097
07960
222
28222
001.00
95185
88
Ga
1162
76539
92634
46991
03985
♡♡
21564
89845
06779
70722
45685
15364
83314
93780
Level of Significance for Two-Tailed Test, a
0.10 0.05 0.02 0.01 0.001
1994 2.380 2.647
2 646
2.640
09799
63794
51887
86412
09333
80161
80883
86022
37706
82522
80875
92786
72
98% 99% 99.9%
20470
34417
07239
0745
PERE
0.01 0.005 0.0005
40402
39578
0.001
636.619
31.599
12.924
8.610
6.869
2.379 2:070
2377 2643 3425
5.959
5.408
5.041
4.701
4.587
4437
4.318
4.221
4.015
3.965
3.922
3.850
3.819
3.725
3.707
3 674
3,646
3.601
3.591
3.431
3.431
3.423
3.421
m
3.415
20
82
83319
14491
20170
49197
84822
****
33202
36306
66124
ACACA
72060
77799
05440
27909
35681
33804
21566
51570
28292
72402
71859
90151
69125
00014
18629
79077
53169
16175
57479
12584
83371
36797
77722
44562
21063
28090
22651
04401
EX
70553
1040
10040
01109
77868
4 42 45 4 45
80295
99518
COMED
85967
9259
56/10
22498
51 52 53 54 55 55558
89731
28898 82332
59601
52441
54505
05467
43690
80006
65796
880
73558
78187
62632
83736
46516
12609
19207
68766
88159
97054
-----
53746
54194
24374
1518
82845
0 t
Right-tailed test
----
52498
57179
936.34
97728
07088
3997
29255
86746
12189
05024
09627
22242
22970
0.20 0.10
36 1.306 688
37 1.305 1.687
38 1.304 1.686
39 1.304
41 1.303
42 1.302
43 1.302
44 1.301
45 1.301
df 0.10 0.05 0.025
88
80% 90% 95%
888
1.682
1.681
1.600
-
1 294 1.668
1.294 1.668
1.294
1.294
79741
93394
ZA
74CA
01704
1:070
1560
49186
55400
56377
19239
1.669
89 1.291 1.662
1.662
95069
67025
32357
88272
0.05
2.028
2.026
2.024
1.685 2.023
1.303 1.684
2.021
50113
21727
00126
25542
72915
27495
06112
53956
06016
49644
57171
69413
24371
33437
60303
46516
52153
31232
11131
39139
84193
4469
20200
52560
89754
47535
05220
55809
33307
05 405
20600
48130
84349
NNNe
G
2
A
N
=
ܢܝ
Level of Significance for One-Tailed Test, a
74599
34691
Swee
Confidence intervals, c
98%
19624
Level of Significance for Two-Tailed Test,
0.05
1.987
1.987
88247
17175
71625
85428
1985
18625
1.660
1.658
1.656
1.654
1.653 1.973
1.653
30667
90610
22024
21119
51141
35599
61056
81466
1.977
1.975
6
34532
08169
24709
94297
92686
-t 0 t
Two-tailed test
86857
97016
74639
68519
23259
70339
19197
61782
12219
90900
22448
67877
65766
24937
44143
25658
07292
53628
5148
07067
12245
19202
09184
2.431
2.429
2.426
2.423
2.416
1.994 2.381
Confidence Intervals, c
2
001
2.382
Za
80% 90% 95%
Level of Significance for One-Tailed Test, a
df 0.10 0.05 0.025
Level of Significance for Two-Tailed Test, a
0.20 0.10
1.986
2.368
1.986 2.368
1.986 2.367
1.986 2.367
1.985
2.366
2.695
6
0.01 0.005 0.0005
1.972 2.345
0.02 0.01 0.001
2434 2.719
3.582
2.715
3.574
2.712
3.566
2.708
69
2.654
2.651
2.650
2,649
2.648
75 74
NNNN
तततत
84379
14985
4007
21898
99% 99.9%
NNNNN
39967
*****
08601
55721
92405
22
20850
22921
80631
720.40
84138
75666
89205
2256
57808
11261
==
06978
12529
84870
31702
86290
30782
03040
96196
62727
81877
44032
55920
18172
22571
01549
41210
79548
97687
10***
20000
12000
10510
51695
90689
70603
98% 99% 99.9%
0.01 0.005 0.0005
0.02 0.01 0.001
2.102
2.369
2.368 2.632
2632
2622
3.402
2631
2.627
3.558
3.551
2.350
2.607
2.347 2.603
2.601
3.532
3.520
4 38
3.515
m
...
3.447
3.444
3.437
3.435
3401
3.399
3.398
3.397
3.396
3.393
3.392
3.390
3.373
3.352
3.340