Obtain the sensitivity curves for the sample mean, the sample median and the HodgesLehmann estimator for the
Question:
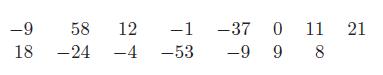
Obtain the sensitivity curves for the sample mean, the sample median and the Hodges–Lehmann estimator for the following data set. Evaluate the curves at the values −300 to 300 in increments of 10 and graph the curves on the same plot. Compare the sensitivity curves.
Transcribed Image Text:
-9 58 12 -1 18 -24 -4 -53 -37 0 11 21 -9 9 8
Fantastic news! We've Found the answer you've been seeking!
Step by Step Answer:
Answer rating: 64% (14 reviews)
In general if we consider sampling from a distribution with mean then the sample mean is given ...View the full answer
Answered By
Brian Otieno
I'm Brian , an experienced professional freelancer with countless hours of success in freelancing many subjects in different disciplines. Specifically, I have handled many subjects and excelled in many disciplines. I have worked on many Computer Science projects and have been able to achieve a lot in that field. Additionally, I have handled other disciplines like History, Humanities, Social Sciences, Political science, Health care and life science, and Religion / Theology. My experience generally in these subjects has made me able to deliver high-quality projects in a very timely fashion. I am very reliable at my job and will get the work done in time, no matter what. In Addition, I have managed to ensure that the work meets my client's expectations and does not cause an error. I am a hard-working and diligent person who is highly responsible for everything I do. Generally, Freelancing has made me more accountable for doing my job. Additionally, I have had a passion for writing for the last seven years in this field.
0.00
0 Reviews
10+ Question Solved
Related Book For
Introduction To Mathematical Statistics
ISBN: 9780321794710
7th Edition
Authors: Robert V., Joseph W. McKean, Allen T. Craig
Question Posted:
Students also viewed these Business questions
-
The Pitman Estimator of Location (see Lehmann and Casella 1998 Section 3.1, or the original paper by Pitman 1939) is given by where we observe a random sample X1,..., Xn from f(x - θ)....
-
Following are three sample equations. Plot them on a graph in which Q is on the vertical axis and P is on the horizontal axis. Then transform these equations so P is expressed in terms of (J and plot...
-
On January 1, Lehmann Corporation paid the annual royalty of $720,000 for rights to use patented technology to make batteries for laptop computers. Lehmann plans to use the patented technology to...
-
How can adults continue to function relatively normally after surgery to remove the thymus, tonsils, spleen, or lymph nodes?
-
Use the information in E11- 13, part ( a) to prepare the required footnote disclosure under IFRS for Kurtis Koal Company, Inc. s property, plant, and equipment for years 1 and 2, including a...
-
The following is taken from the Kijak Corp. balance sheet.Interest is payable semiannually on January 1 and July 1. The bonds are callable on any semiannual interest date. Kijak uses straight-line...
-
The following are the balances of the assets, liabilities, and equity of Hair Today Salon at July 31, 2010: Requirements 1. What type of business organization is Hair Today Salon? 2. Prepare the...
-
Refer to the scenario described in Problem 10 and the file BlueOrRed. Partition the data into training (50 percent), validation (30 percent), and test (20 percent) sets. Fit a classification tree...
-
A single doughnut production facility is needed to meet the daily delivery demands of four markets, all of which are at intersections in a road system that has been constructed as a grid. The...
-
Donna Jamison was recently hired as a financial analyst by Computron Indus tries a manufacturer of electronic components. Her first task was to conduct a financial analysis of the firm covering the...
-
Let X be a random variable with cdf F(x) and let T (F) be a functional. We say that T (F) is a scale functional if it satisfies the three properties Show that the following functionals are scale...
-
Let X be a continuous random variable with pdf f(x). Suppose f(x) is symmetric about a; i.e., f(x a) = f((x a)). Show that the random variables X a and (X a) have the same pdf.
-
Explain why some shaping operations, such as blow molding and film-bag making, are done vertically and why buildings that house equipment for these operations have ceilings 10 to 15 m (35 to 50 ft)...
-
What parameters identify a security association in Databases?
-
What information concerning the communication studies discipline, including history, may prove valuable when discussing your qualifications with prospective employers, post-undergrad internship...
-
Tanner's gross pay for the week is $ 1 9 0 0 . His yearly pay is under the limit for OASDI. Assume that the rate for state and federal unemployment compensation taxes is 6 % and that Tanner's year to...
-
On March 1 2023, Blossom Winery Ltd. purchased a five-hectare commercial vineyard for $1,049,050. The total purchase price was based on appraised market values of the building, grapevines, and...
-
What is the formal term for a system element that is under configuration management and can include hardware items as well as software items ?
-
Which of the following formulas define norms on R3? (a) ||v|| = 2v21 + v22 + 3v23 (b) ||v|| = v21 + 2v1v2 + v22 + v23 (c) ||v|| = max {v1,|, |v2|, |v3|} (d) ||v|| = {v1, - v2| + |v2 - v3| + |v3 - v1}...
-
A. Select a recent issue (paper or online) of Report on Business Magazine, Canadian Business Magazine (online only), Bloomberg Businessweek, Fast Company, The Economist, or another business magazine....
-
Suppose a total of n = 9 measurements are to be taken on a simple linear model, where the xis will be set equal to 1, 2, . . . , and 9. If the variance associated with the xy-relationship is known to...
-
Prove the useful computing formula (Equation 11.3.5) that --' - -- i=1 i=l i=l i=1
-
The sodium nitrate (NaNO3) solubility data in Question 11.2.3 is described nicely by the regression line y = 67.508 + 0.871x, where s = 0.959. Construct a 90% confidence interval for the y-intercept,...
-
For each of the following: identify all critical numbers and use these to determine all region(s) where the function is increasing as well as all region(s) where the function is decreasing. Then...
-
Determine the most suitable data structure for the above graph and show it adjacency representation. (5 markah/marks)
-
The table gives the outdoor temperatures observed by a science student on a spring day. Draw a graph of the data, and find the average rate of change of temperature between the following times: a)...
Study smarter with the SolutionInn App