Researchers have collected data from a sample of nine individuals on the number of hours of television
Question:
Researchers have collected data from a sample of nine individuals on the number of hours of television watched in a day and the age of the individual. They are interested in estimating if age is related to the number of hours of television watched each day. The scatterplot in Figure 6.21 shows the relationship between the number of hours of television watched in a day and the age of the individual.
a. Describe the relationship between age and the number of hours of television watched.
b. Which variable is the response variable and which variable is the predictor variable? The equation of the line of best fit, can be obtained from Figure 6.22:
c. Complete Table 6.7 (round to 4 decimal places).
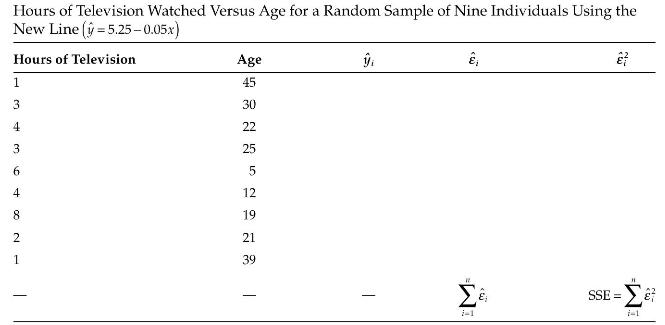
d. Using Table 6.7, find and SSE for the line of best fit. Now consider the following linear equation that is not the line of best fit that is illustrated in Figure 6.23.
e. Complete Table 6.8 (round to 4 decimal places) using this new line.
f. Find and SSE for this new line.
g. What can you say about the difference in the statistics and SSE
for the two different lines?
Figure 6.21
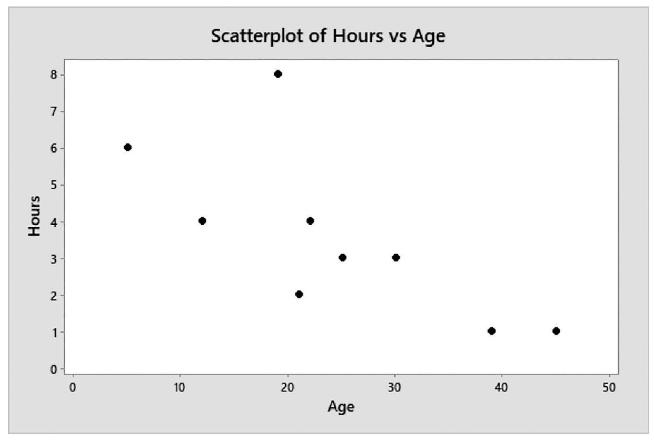
Figure 6.22
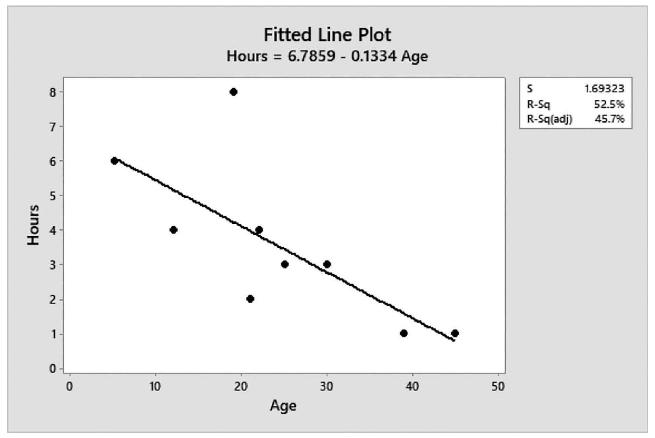
Figure 6.23
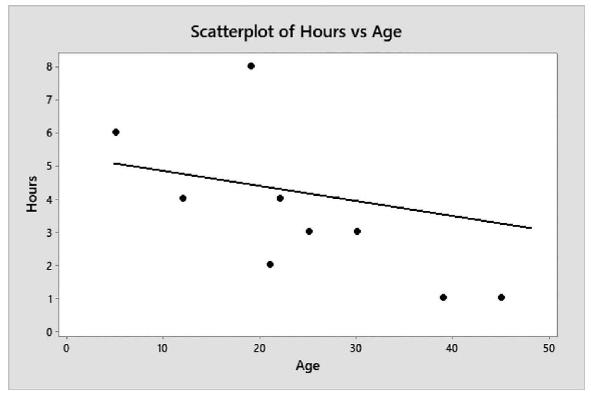
Table 6.7
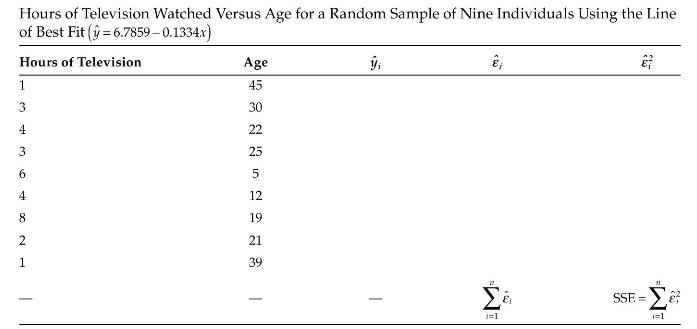
Table 6.8
Step by Step Answer: