Question:
The data in Figure 9.19 are from running a multiple regression analysis to develop a model that predicts the selling price of homes based on the number of bedrooms, the number of bathrooms, square footage, the age of the home, lot size, the number of garages, and the number of stories.
a. Is the overall model useful in predicting the sale price of homes?
b. Write the population regression equation.
c. Write the estimated regression equation.
d. Find and interpret the coefficient of determination.
e. Using the results from the regression analysis, determine if newer homes have higher selling prices and if larger homes have higher selling prices.
f. Do you think that multicollinearity is a concern?
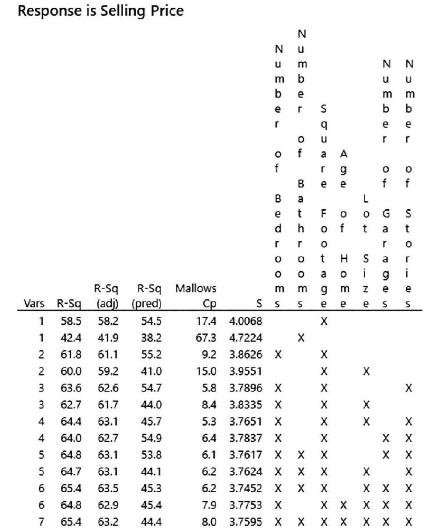
g. A printout of a best subsets regression is given in Figure 9.20. Find a bestfitting model using the three-model selection criteria of \(R^{2}, R_{\mathrm{adj}}^{2}\), and \(C_{p}\) and justify why you selected this model.
Figure 9.19
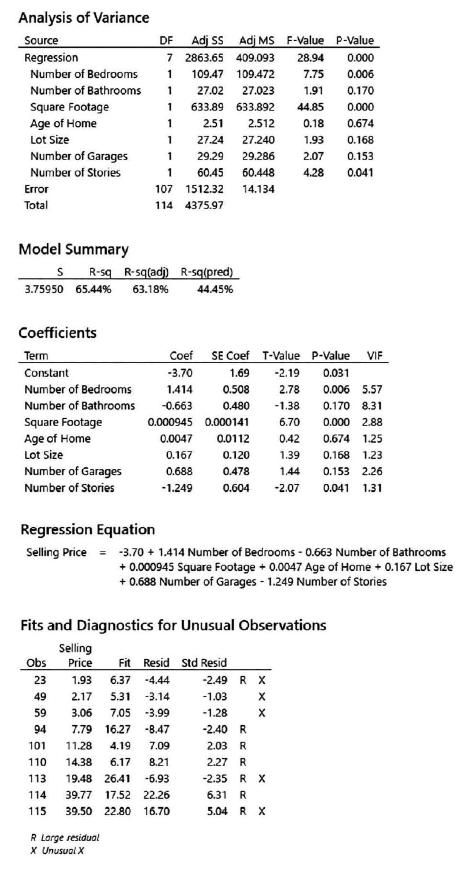
Figure 9.20
Transcribed Image Text:
Analysis of Variance Source DF Adj SS Adj MS F-Value P-Value Regression 7 2863.65 409.093 28.94 0.000 Number of Bedrooms 1 109.47 109.472 7.75 0.006 Number of Bathrooms 1 27.02 27.023 1.91 0.170 Square Footage 1 633.89 633.892 44.85 0.000 Age of Home 1 2.51 2.512 0.18 0.674 Lot Size 1 27.24 27.240 1.93 0.168 Number of Garages 1 29.29 29.286 2.07 0.1531 Number of Stories 1 60.45 60.448 4.28 0.041 Error 107 1512.32 14.134 Total 114 4375.97 Model Summary S R-sq R-sq(adj) R-sq(pred) 65.44% 3.75950 63.18% 44.45% Coefficients Term Coef SE Coef T-Value P-Value VIF Constant -3.70 1.69 -2.19 0.031 Number of Bedrooms 1.414 0.508 2.78 0.006 5.57 Number of Bathrooms -0.663 0.480 -1.38 0.170 8.31 Square Footage 0.000945 0.000141 6.70 0.000 2.88 Age of Home 0.0047 0.0112 0.42 0.674 1.25 Lot Size 0.167 0.120 1.39 0.168 1.23 Number of Garages 0.688 0.478 1.44 0.153 2.26 Number of Stories -1.249 0.604 -2.07 0.041 1.31 Regression Equation Selling Price = -3.70 + 1.414 Number of Bedrooms - 0.663 Number of Bathrooms + 0.000945 Square Footage +0.0047 Age of Home + 0.167 Lot Size +0.688 Number of Garages - 1.249 Number of Stories Fits and Diagnostics for Unusual Observations Selling Obs Price Fit Resid Std Resid 23 1.93 6.37 -4.44 -2.49 R X 49 2.17 5.31 -3.14 -1.03 X 59 3.06 7.05 -3.99 -1.28 X 7.79 16.27 -8.47 -2.40 R 2.03 R 94 101 11.28 4.19 7.09 110 14.38 6.17 8.21 113 19.48 26.41 -6.93 114 39.77 17.52 22.26 115 39.50 22.80 16.70 R Large residual X Unusual X 2.27 R -2.35 R X 6.31 R 5.04 R X