

The following chart presents a visual summary of a studys data. a. What is this chart called?b.
Question:
The following chart presents a visual summary of a study’s data.
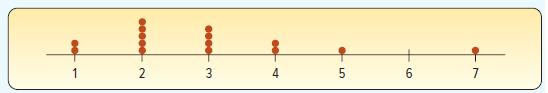
a. What is this chart called?b. How many observations are in the study?c. What are the minimum, maximum, and range of the data?d. How would you describe the shape of the distribution: bell shaped, negatively skewed, or positively skewed?e. Visually, estimate the central location of the distribution.f. Find the mode of the distribution. Why is this value the mode?g. Find the median of the distribution. Why is this value the median?h. Using the weighted mean, calculate the mean. Hint: Use the frequencies as the weights.i. How do the values of the mode, median, and mean compare?
Fantastic news! We've Found the answer you've been seeking!
Step by Step Answer:
a Dot plot b 15 c The minimum value is 1 the maximum value is 7 The range is 7 1 6 d The shape of th...View the full answer

Answered By
Muhammad Umair
I have done job as Embedded System Engineer for just four months but after it i have decided to open my own lab and to work on projects that i can launch my own product in market. I work on different softwares like Proteus, Mikroc to program Embedded Systems. My basic work is on Embedded Systems. I have skills in Autocad, Proteus, C++, C programming and i love to share these skills to other to enhance my knowledge too.
1+ Reviews
10+ Question Solved
Related Book For 

Statistical Techniques In Business And Economics
ISBN: 9781265779696
19th Edition
Authors: Douglas Lind, William Marchal, Samuel Wathen
Question Posted:
