

The following data report total, monthly U.S. book-store sales in millions of dollars from January 2019 to
Question:
The following data report total, monthly U.S. book-store sales in millions of dollars from January 2019 to December 2021. (Go to https://www.census.gov/retail/index.html#mrts, find “Monthly Retail Trade Report,” then select “Time Series/Trend Charts” to find the data for the total U.S. bookstore sales.)
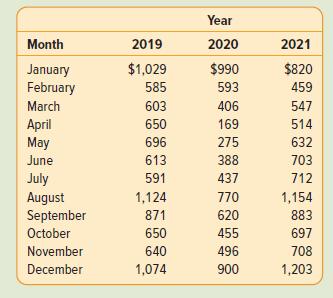
a. Graph the data.b. Based on the graph, describe the time series pattern.c. For this time series, why is forecasting with a seasonally adjusted trend model appropriate?d. Evaluate a seasonally adjusted trend forecasting model. What are the MAD and MAPE?e. What is the average monthly trend in book-store sales?f. What are the monthly indexes? When are book sales the highest? When are book sales the lowest?g. Predict book sales for the next 9 months.h. In your judgment, are the forecasts “good”? What disclaimer would you include with your forecast?
Step by Step Answer:
a b The time series has definite seasonality with peaks occurring in the December and January follow...View the full answer


Statistical Techniques In Business And Economics
ISBN: 9781265779696
19th Edition
Authors: Douglas Lind, William Marchal, Samuel Wathen
