The kurtosis of a variable represents a measure of how the distribution of a variable is peaked
Question:
The kurtosis of a variable represents a measure of how the distribution of a variable is peaked (in other words, how "sharp" the data set appears when you consider its distribution). The kurtosis can be used to gauge whether the distribution of a variable differs from the normal distribution. For instance, the closer the kurtosis value is to 0 , the more normally distributed the variable is; the closer the kurtosis value is to 1 , the sharper the peak of the distribution; and a negative kurtosis value represents more of a flat distribution. The formula for kurtosis is as follows:
\[\text { Kurtosis }=\left[\frac{n(n+1)}{(n-1)(n-2)(n-3)}ight] \cdot\sum_{i=1}^{n}\left(\frac{x_{i}-\bar{x}}{s}ight)^{4}-\frac{3(n-1)^{2}}{(n-2)(n-3)}\]
where \(n\) is the sample size, \(x_{i}\) are the individual observations, \(\bar{x}\) is the sample mean, and \(s\) is the sample standard deviation for the given data.
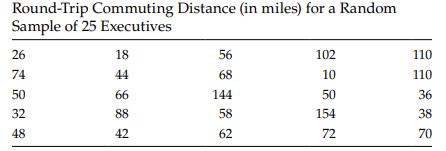
a. For the round-trip commuting distance data set in Table 2.1, draw a histogram and calculate the value of the kurtosis statistic.
b. Does the measure of kurtosis make sense for the shape of the distribution for the commuting distance data set in Table 2.1?
Table 2.1
Step by Step Answer:

This question has not been answered yet.
You can Ask your question!