

An investment advisor is studying the relationship between a common stocks price to earnings (P/E) ratio and
Question:
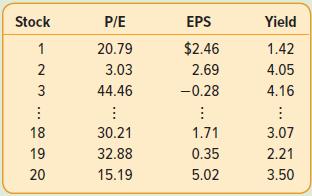
An investment advisor is studying the relationship between a common stock’s price to earnings (P/E) ratio and factors that she thinks would influence it. She has the following data on the earnings per share (EPS) and the dividend percentage (Yield) for a sample of 20 stocks.
a. Compute and report the correlation matrix. Review the correlation coefficients for the independent variables. Do they indicate multicollinearity? Why?
b. Compute and report a multiple regression equation with P/E as the dependent variable.
c. Apply the stepwise procedure to remove insignificant independent variables. Report the regression equation.
d. Interpret the relationship between the dependent and independent variable in part “(c)”.
e. Plot the fitted values against the residuals. Does the graph display evidence of homoscedasticity?
f. Would you use this regression equation to accurately predict the price to earnings ratio? Why?
Step by Step Answer:
a The correlation between the independent variables yield and EPS is ...View the full answer


Statistical Techniques In Business And Economics
ISBN: 9781260239478
18th Edition
Authors: Douglas Lind, William Marchal, Samuel Wathen
