

For the year 2018, Fred Friendly completed a total of 80 returns. He developed the following table
Question:
For the year 2018, Fred Friendly completed a total of 80 returns. He developed the following table summarizing the relationship between number of dependents and whether or not the client received a refund.
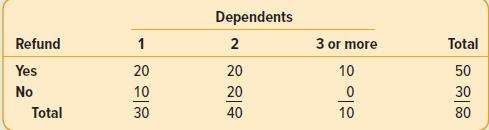
a. What is the name given to this table?
b. What is the probability of selecting a client who received a refund?
c. What is the probability of selecting a client who received a refund or had one dependent?
d. Given that the client received a refund, what is the probability he or she had one dependent?
e. What is the probability of selecting a client who did not receive a refund and had one dependent?
Fantastic news! We've Found the answer you've been seeking!
Step by Step Answer:
a The name of the available table is contingency table B calculate the probability that selec...View the full answer

Answered By
Irfan rao
I am in this profession of teaching in an university for about 5 years. Every time whenever I am going to teach a class as a part of this noble profession .....I am learning also. I am trying consistently ....how to represent, interpret, summarize and rethink about the whole concept I wish to teach or rather inspire my students in a specific period of time assigned to me.
0 Reviews
10+ Question Solved
Related Book For 

Statistical Techniques In Business And Economics
ISBN: 9781260239478
18th Edition
Authors: Douglas Lind, William Marchal, Samuel Wathen
Question Posted:
