Question:
Refer to the Baseball 2018 data that report information on the 30 Major League Baseball teams for the 2018 season. Create a frequency distribution for the Team Salary variable and answer the following questions.
a. What is the typical salary for a team? What is the range of the salaries?
b. Comment on the shape of the distribution. Does it appear that any of the teams have a salary that is out of line with the others?
c. Draw a cumulative relative frequency distribution of team salary. Using this distribution, 40% of the teams have a salary of less than what amount? About how many teams have a total salary of more than $205 million?
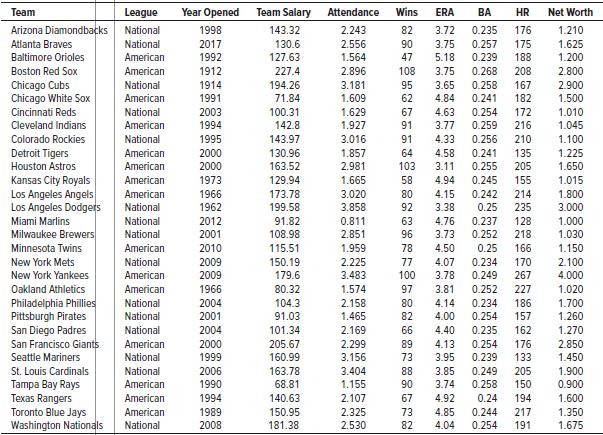
Data From Baseball 2018:
Transcribed Image Text:
Team League Year Opened Team Salary Attendance Wins ERA BA HR Net Worth Arizona Diamondbacks National 1998 143.32 2.243 82 3.72 0.235 176 1.210 Atlanta Braves National 2017 130.6 2.556 90 3.75 0.257 175 1.625 Baltimore Orioles American 1992 127.63 1.564 47 5.18 0.239 188 1.200 Boston Red Sox American 1912 227.4 2.896 108 3.75 0.268 208 2.800 1914 3.65 Chicago Cubs Chicago White Sox Cincinnati Reds National American 194.26 71.84 3.181 95 0.258 167 2.900 1991 1.609 62 4.84 0.241 182 1.500 National 2003 100.31 1.629 67 4.63 0.254 172 1.010 Cleveland Indians American 1994 142.8 1.927 91 3.77 0.259 216 1.045 Colorado Rockies National 1995 143.97 3.016 91 4.33 0.256 210 1.100 1.225 Detroit Tigers Houston Astros American 2000 130.96 1.857 64 4.58 0.241 135 American 2000 163.52 2.981 103 3.11 0.255 205 1.650 Kansas City Royals Los Angeles Angels Los Angeles Dodgers American 1973 129.94 1.665 58 4.94 155 0.245 0.242 1.015 3.020 3.858 American 1966 173.78 80 4.15 214 1.800 National 1962 199.58 92 3.38 0.25 235 3.000 Miami Marlins National 2012 91.82 0.811 63 4.76 0.237 128 1.000 Milwaukee Brewers National 2001 108.98 2.851 96 3.73 0.252 218 1.030 Minnesota Twins American 2010 115.51 1.959 78 4.50 0.25 166 1.150 New York Mets National 2009 150.19 2.225 77 4.07 0.234 170 2.100 New York Yankees Oakland Athletics American 2009 179.6 3.483 100 3.78 0.249 267 4.000 American 1966 80.32 1.574 97 3.81 0.252 227 1.020 Philadelphia Phillies Pittsburgh Pirates San Diego Padres San Francisco Giants National 2004 104.3 2.158 80 4.14 0.234 186 1.700 National 2001 91.03 1.465 82 4.00 0.254 157 1.260 National 2004 101.34 2.169 66 4.40 0.235 162 1.270 American 2000 205.67 2.299 89 4.13 0.254 176 2.850 1.450 Seattle Mariners National 1999 160.99 3.156 73 3.95 0.239 133 St. Louis Cardinals Tampa Bay Rays Texas Rangers Toronto Blue Jays Washington Nationals 2006 163.78 68.81 National 3.404 88 3.85 0.249 205 1.900 0.900 American 1990 1.155 90 3.74 0.258 150 American 1994 140.63 2.107 67 4.92 0.24 194 1.600 American 1989 150.95 2.325 73 4.85 0.244 217 1.350 National 2008 181.38 2.530 82 4.04 0.254 191 1.675


