

Refer to the Baseball 2018 data, which reports information on the 30 Major League Baseball (MLB) teams
Question:
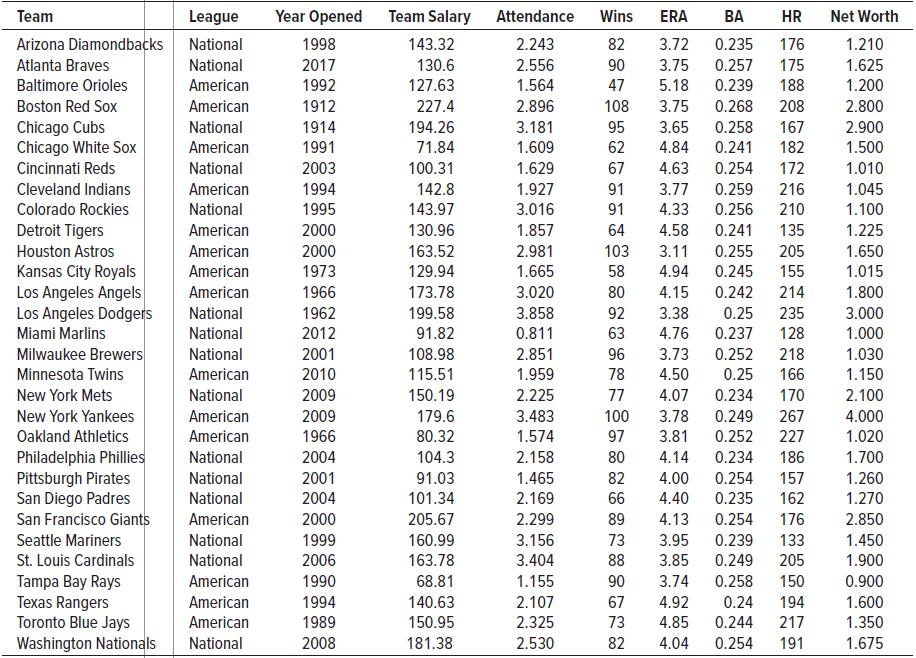
Refer to the Baseball 2018 data, which reports information on the 30 Major League Baseball (MLB) teams for the 2018 season.
a. In the Major Baseball League, each team plays 162 games in a season. A rule-ofthumb is that 90 or more wins in a season qualifies a team for the post-season playoffs. To summarize the 2018 season, create a frequency table of wins. Start the first class at 40 and use a class interval of 10.
a. What is the probability that a team wins 90 or more games?
b. In the playoffs, only 10 teams can enter the playoffs. Based on the 2018 season, what is the probability that a team that wins 90 or more games makes the playoffs?
c. Make a statement based on your responses to parts (a) and (b).
b. Presently the National League requires that all fielding players, including pitchers, take a turn to bat. In the American League, teams can use a designated hitter (DH) to take the pitcher’s turn to bat. For each league, create a frequency distribution and a relative frequency distribution of teams based on the season total of home runs. For the frequency distributions, start the first class at 120 home runs and use a class interval of 30.
a. In the American League, what is the probability that a team hits 180 or more home runs?
b. In the National League, what is the probability that a team hits 180 or more home runs?
c. Make statements comparing the two distributions.
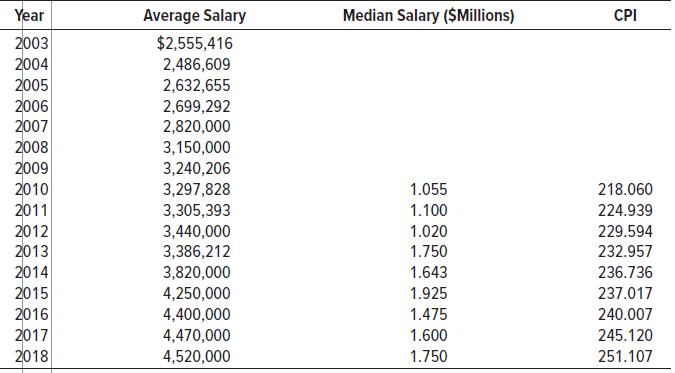
Data From Baseball 2018:
Step by Step Answer:
a Wins Teams 4049 1 5059 1 6069 6 7079 4 8089 7 9099 8 100109 3 Grand Total 30 1 1130 037 2 1...View the full answer


Statistical Techniques In Business And Economics
ISBN: 9781260239478
18th Edition
Authors: Douglas Lind, William Marchal, Samuel Wathen
