

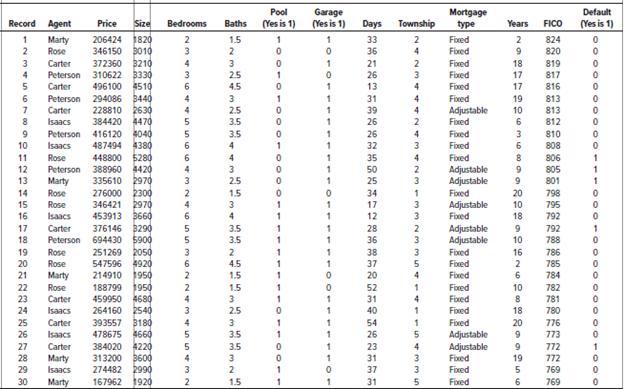
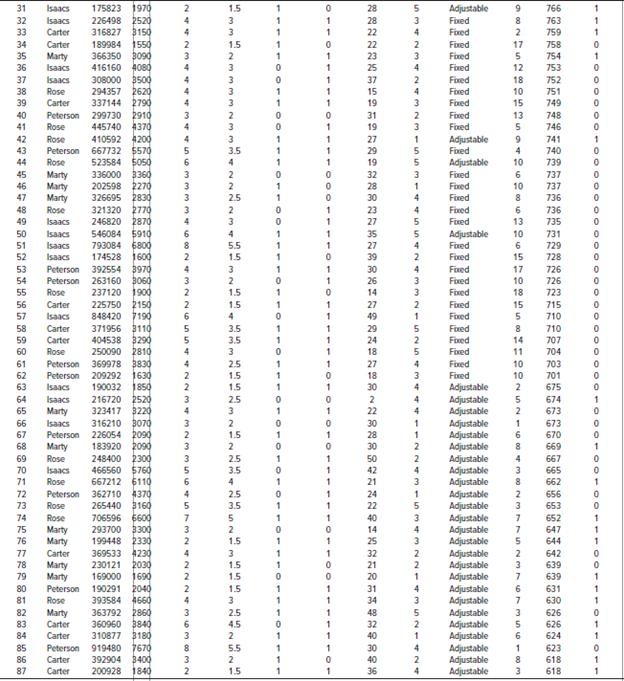
The North Valley Real Estate data reports information on homes on the market. Use the selling price
Question:
The North Valley Real Estate data reports information on homes on the market. Use the selling price of the home as the dependent variable and determine the regression equation using the size of the house, number of bedrooms, days on the market, and number of bathrooms as independent variables.
a. Develop a correlation matrix. Which independent variables have strong or weak correlations with the dependent variable? Do you see any problems with multicollinearity?
b. Use a statistical software package to determine the multiple regression equation. How did you select the variables to include in the equation? How did you use the information from the correlation analysis? Show that your regression equation shows a significant relationship. Write out the regression equation and interpret its practical application. Report and interpret the R-square.
c. Using your results from part (b), evaluate the addition of the variables: pool or garage. Report your results and conclusions.
d. Develop a histogram of the residuals from the final regression equation developed in part (c). Is it reasonable to conclude that the normality assumption has been met?
e. Plot the residuals against the fitted values from the final regression equation developed in part (c). Plot the residuals on the vertical axis and the fitted values on the horizontal axis.
Data From North Valley Real Estate:
Step by Step Answer:
a The correlation matrix is as follows The correlations for strong positive relationships between Price and the independent variables Bedrooms Size an...View the full answer


Statistical Techniques In Business And Economics
ISBN: 9781260239478
18th Edition
Authors: Douglas Lind, William Marchal, Samuel Wathen
