

Using the time series data in the table, respond to the following items. a. G raph the
Question:
Using the time series data in the table, respond to the following items.
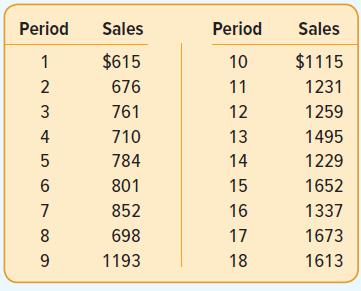
a. G raph the data.
b. Based on the graph, describe the time series pattern.
c. For this time series, why is forecasting with a trend model appropriate?
d. E valuate a trend forecasting model using simple linear regression. What is the MAD?
e. What is the predicted annual change of industry sales?
f. Predict sales for the next three periods.
Fantastic news! We've Found the answer you've been seeking!
Step by Step Answer:
a b The graph shows a positive time series trend in sales c A ...View the full answer

Answered By
Areesha Fatima
Hey! Areesha here. I have recently completed my bachelors in software engineering and am currently pursuing my masters in the same. As a tutor, I try my best to put myself in my students' shoes so that I can better understand where they are having difficulty understanding and so we can explore ways to resolve the issue together. I teach, keeping in mind the level of my students, and that has proven super beneficial for me so far. I will ensure the same practices for my students here as well.
0 Reviews
10+ Question Solved
Related Book For 

Statistical Techniques In Business And Economics
ISBN: 9781260239478
18th Edition
Authors: Douglas Lind, William Marchal, Samuel Wathen
Question Posted:
