

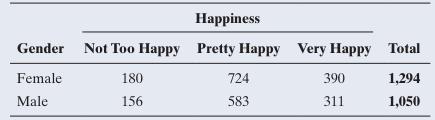
The contingency table shown relates happiness and gender for the 2018 GSS. (You can enter the counts
Question:
The contingency table shown relates happiness and gender for the 2018 GSS. (You can enter the counts from the table in the second tab of the Explore Categorical Variables app to answer most of the following questions.)
a. Identify the response variable and the explanatory variable.
b. Construct a table or graph showing the conditional distributions. Interpret.
c. Give an example of what the population conditional distributions would look like if gender and happiness were independent. For the example, try to choose conditional percentages that are consistent with the results of the 2018 GSS.
Step by Step Answer:

This question has not been answered yet.
You can Ask your question!
Related Book For 
Statistics The Art And Science Of Learning From Data
ISBN: 9781292444765
5th Global Edition
Authors: Alan Agresti, Christine A. Franklin, Bernhard Klingenberg
Question Posted:
