

The market research department of a chain of hamburger restaurants wants to compare the mean monthly sales
Question:
The market research department of a chain of hamburger restaurants wants to compare the mean monthly sales of hamburgers under three different marketing strategies. It randomly assigns 15 restaurants to the three groups, five per group. The sample means for the three groups were 1800,1500 , and 1200 . The table shows the ANOVA table from SPSS.
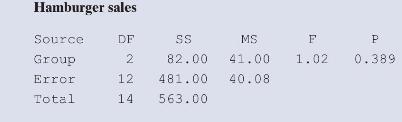
a. Report and interpret the P-value for the ANOVA \(F\) test.
b. For the Tukey \(95 \%\) multiple comparison confidence intervals comparing each pair of means, calculate the margin of error. Explain why it will be the same for all pairs of means.
Fantastic news! We've Found the answer you've been seeking!
Step by Step Answer:

Answered By
Amos Kiprotich
I am a wild researcher and I guarantee you a well written paper that is plagiarism free. I am a good time manager and hence you are assured that your paper will always be delivered a head of time. My services are cheap and the prices include a series of revisions, free referencing and formatting.
15+ Reviews
21+ Question Solved
Related Book For 

Statistics The Art And Science Of Learning From Data
ISBN: 9781292444765
5th Global Edition
Authors: Alan Agresti, Christine A. Franklin, Bernhard Klingenberg
Question Posted:
