

The Wall Street Journal asked Concur Technologies, Inc., an expense-management company, to examine data from 8.3 million
Question:
The Wall Street Journal asked Concur Technologies, Inc., an expense-management company, to examine data from 8.3 million expense reports to provide insights regarding business travel expenses. Their analysis of the data showed that New York was the most expensive city. The following table shows the average daily hotel room rate (x) and the average amount spent on entertainment (y) for a random sample of 9 of the 25 most visited U.S. cities. These data lead to the estimated regression equation yˆ = 17.49 + 1.0334x. For these data, SSE = 1541.4.
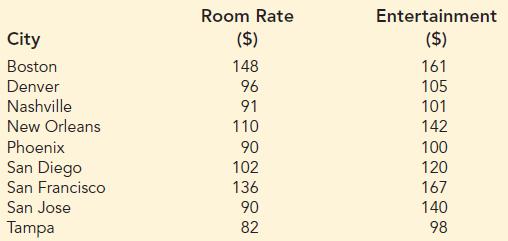
Predict the amount spent on entertainment for a particular city that has a daily room rate of $89.
Step by Step Answer:
a b c x ...View the full answer


Statistics For Business & Economics
ISBN: 9781337901062
14th Edition
Authors: David R. Anderson, Dennis J. Sweeney, Thomas A. Williams, Jeffrey D. Camm, James J. Cochran
