

(a) Draw a Lorenz curve and calculate the Gini coefficient for the 1979 wealth data contained in...
Question:
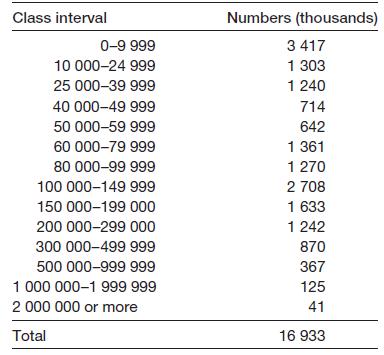
(a) Draw a Lorenz curve and calculate the Gini coefficient for the 1979 wealth data contained in Problem 1.5 (Chapter 1). Draw the Lorenz curve on the same diagram as you used in Problem 10.17.
(b) How does the answer compare to 2001?
Problem 10.17
Fantastic news! We've Found the answer you've been seeking!
Step by Step Answer:
To draw the Lorenz curve and calculate the Gini coefficient for the 1979 wealth data well first need to calculate the cumulative proportions of the wealth distribution and plot them against the cumula...View the full answer

Answered By
Utsab mitra
I have the expertise to deliver these subjects to college and higher-level students. The services would involve only solving assignments, homework help, and others.
I have experience in delivering these subjects for the last 6 years on a freelancing basis in different companies around the globe. I am CMA certified and CGMA UK. I have professional experience of 18 years in the industry involved in the manufacturing company and IT implementation experience of over 12 years.
I have delivered this help to students effortlessly, which is essential to give the students a good grade in their studies.
2+ Reviews
10+ Question Solved
Related Book For 
Statistics For Economics Accounting And Business Studies
ISBN: 978027368308
4th Edition
Authors: Michael Barrow
Question Posted:
