

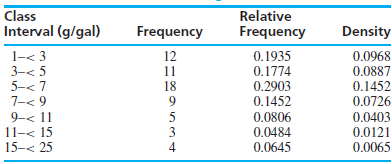
Refer to Table 1.5 (in Section 1.3). a. Using the class intervals in the table, construct a
Question:
a. Using the class intervals in the table, construct a histogram in which the heights of the rectangles are equal to the relative frequencies.
b. Compare the histogram in part (a) with the histogram in Figure 1.9, for which the heights are the densities. Are the shapes of the histograms the same?
c. Explain why the heights should not be set equal to the relative frequencies in this case.
d. Which classes are visually exaggerated by making the heights equal to the relative frequencies?
TABLE 1.5
Fantastic news! We've Found the answer you've been seeking!
Step by Step Answer:
a b No c The class interval wi...View the full answer

Answered By
Mugdha Sisodiya
My self Mugdha Sisodiya from Chhattisgarh India. I have completed my Bachelors degree in 2015 and My Master in Commerce degree in 2016. I am having expertise in Management, Cost and Finance Accounts. Further I have completed my Chartered Accountant and working as a Professional.
Since 2012 I am providing home tutions.
2+ Reviews
10+ Question Solved
Related Book For 
Question Posted:
