

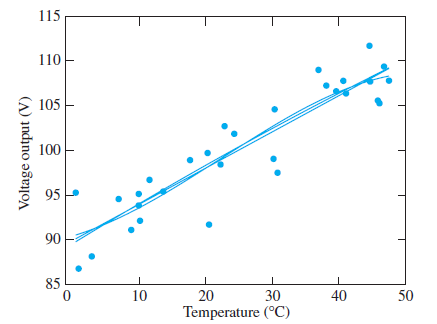
The voltage output (y) of a battery was measured over a range of temperatures (x) from 0°C
Question:
i. The linear model.
ii. The quadratic model.
iii. The cubic model.
iv. All three appear to be about equally good.
Fantastic news! We've Found the answer you've been seeking!
Step by Step Answer:
i The linear model is best The plo...View the full answer

Answered By
Jeff Omollo
As an educator I have had the opportunity to work with students of all ages and backgrounds. Throughout my career, I have developed a teaching style that encourages student engagement and promotes active learning. My education and tutoring skills has enabled me to empower students to become lifelong learners.
5+ Reviews
46+ Question Solved
Related Book For 
Question Posted:
