

A company is analyzing the prices at which its items are sold. Graph the relative frequency histogram
Question:
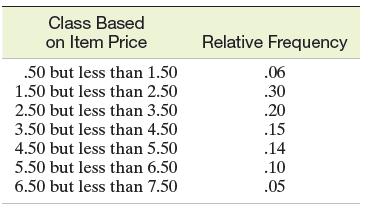
A company is analyzing the prices at which its items are sold. Graph the relative frequency histogram for the 600 items summarized in the accompanying relative frequency table.
Fantastic news! We've Found the answer you've been seeking!
Step by Step Answer:
ANSWER Relative frequen...View the full answer

Answered By
Utsab mitra
I have the expertise to deliver these subjects to college and higher-level students. The services would involve only solving assignments, homework help, and others.
I have experience in delivering these subjects for the last 6 years on a freelancing basis in different companies around the globe. I am CMA certified and CGMA UK. I have professional experience of 18 years in the industry involved in the manufacturing company and IT implementation experience of over 12 years.
I have delivered this help to students effortlessly, which is essential to give the students a good grade in their studies.
2+ Reviews
10+ Question Solved
Related Book For 

Statistics For Business And Economics
ISBN: 9781292227085
13th Global Edition
Authors: Terry Sincich James Mcclave, P. George Benson
Question Posted:
