

A qualitative variable is measured for 20 companies randomly sampled and the data are classified into three
Question:
A qualitative variable is measured for 20 companies randomly sampled and the data are classified into three classes, small (S), medium (M), and large (L), based on the number of employees in each company. The data (observed class for each company) are listed below.
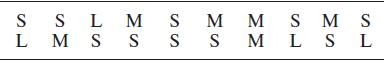
a. Compute the frequency for each of the three classes.
b. Compute the relative frequency for each of the three classes.
c. Display the results, part a, in a frequency bar graph.
d. Display the results, part b, in a pie chart.
Fantastic news! We've Found the answer you've been seeking!
Step by Step Answer:
a The frequency for each of the three classes is as follows ...View the full answer

Answered By
Niala Orodi
I am a competent and an experienced writer with impeccable research and analytical skills. I am capable of producing quality content promptly. My core specialty includes health and medical sciences, but I can competently handle a vast majority of disciplines.
1+ Reviews
10+ Question Solved
Related Book For 

Statistics For Business And Economics
ISBN: 9781292227085
13th Global Edition
Authors: Terry Sincich James Mcclave, P. George Benson
Question Posted:
